
2026 accuracy report · count as of November 4 at 5:15 AM ET
The most accurate poll in America. All three chambers called right.
Our final national poll had Democrats up 13.1. The projected final is 13.0. Below, the final forecast, frozen at 8:49 AM ET on November 3 before the first polls closed, is scored against the count in every race, county and legislative district. 70 races were still counting at this read and are marked.
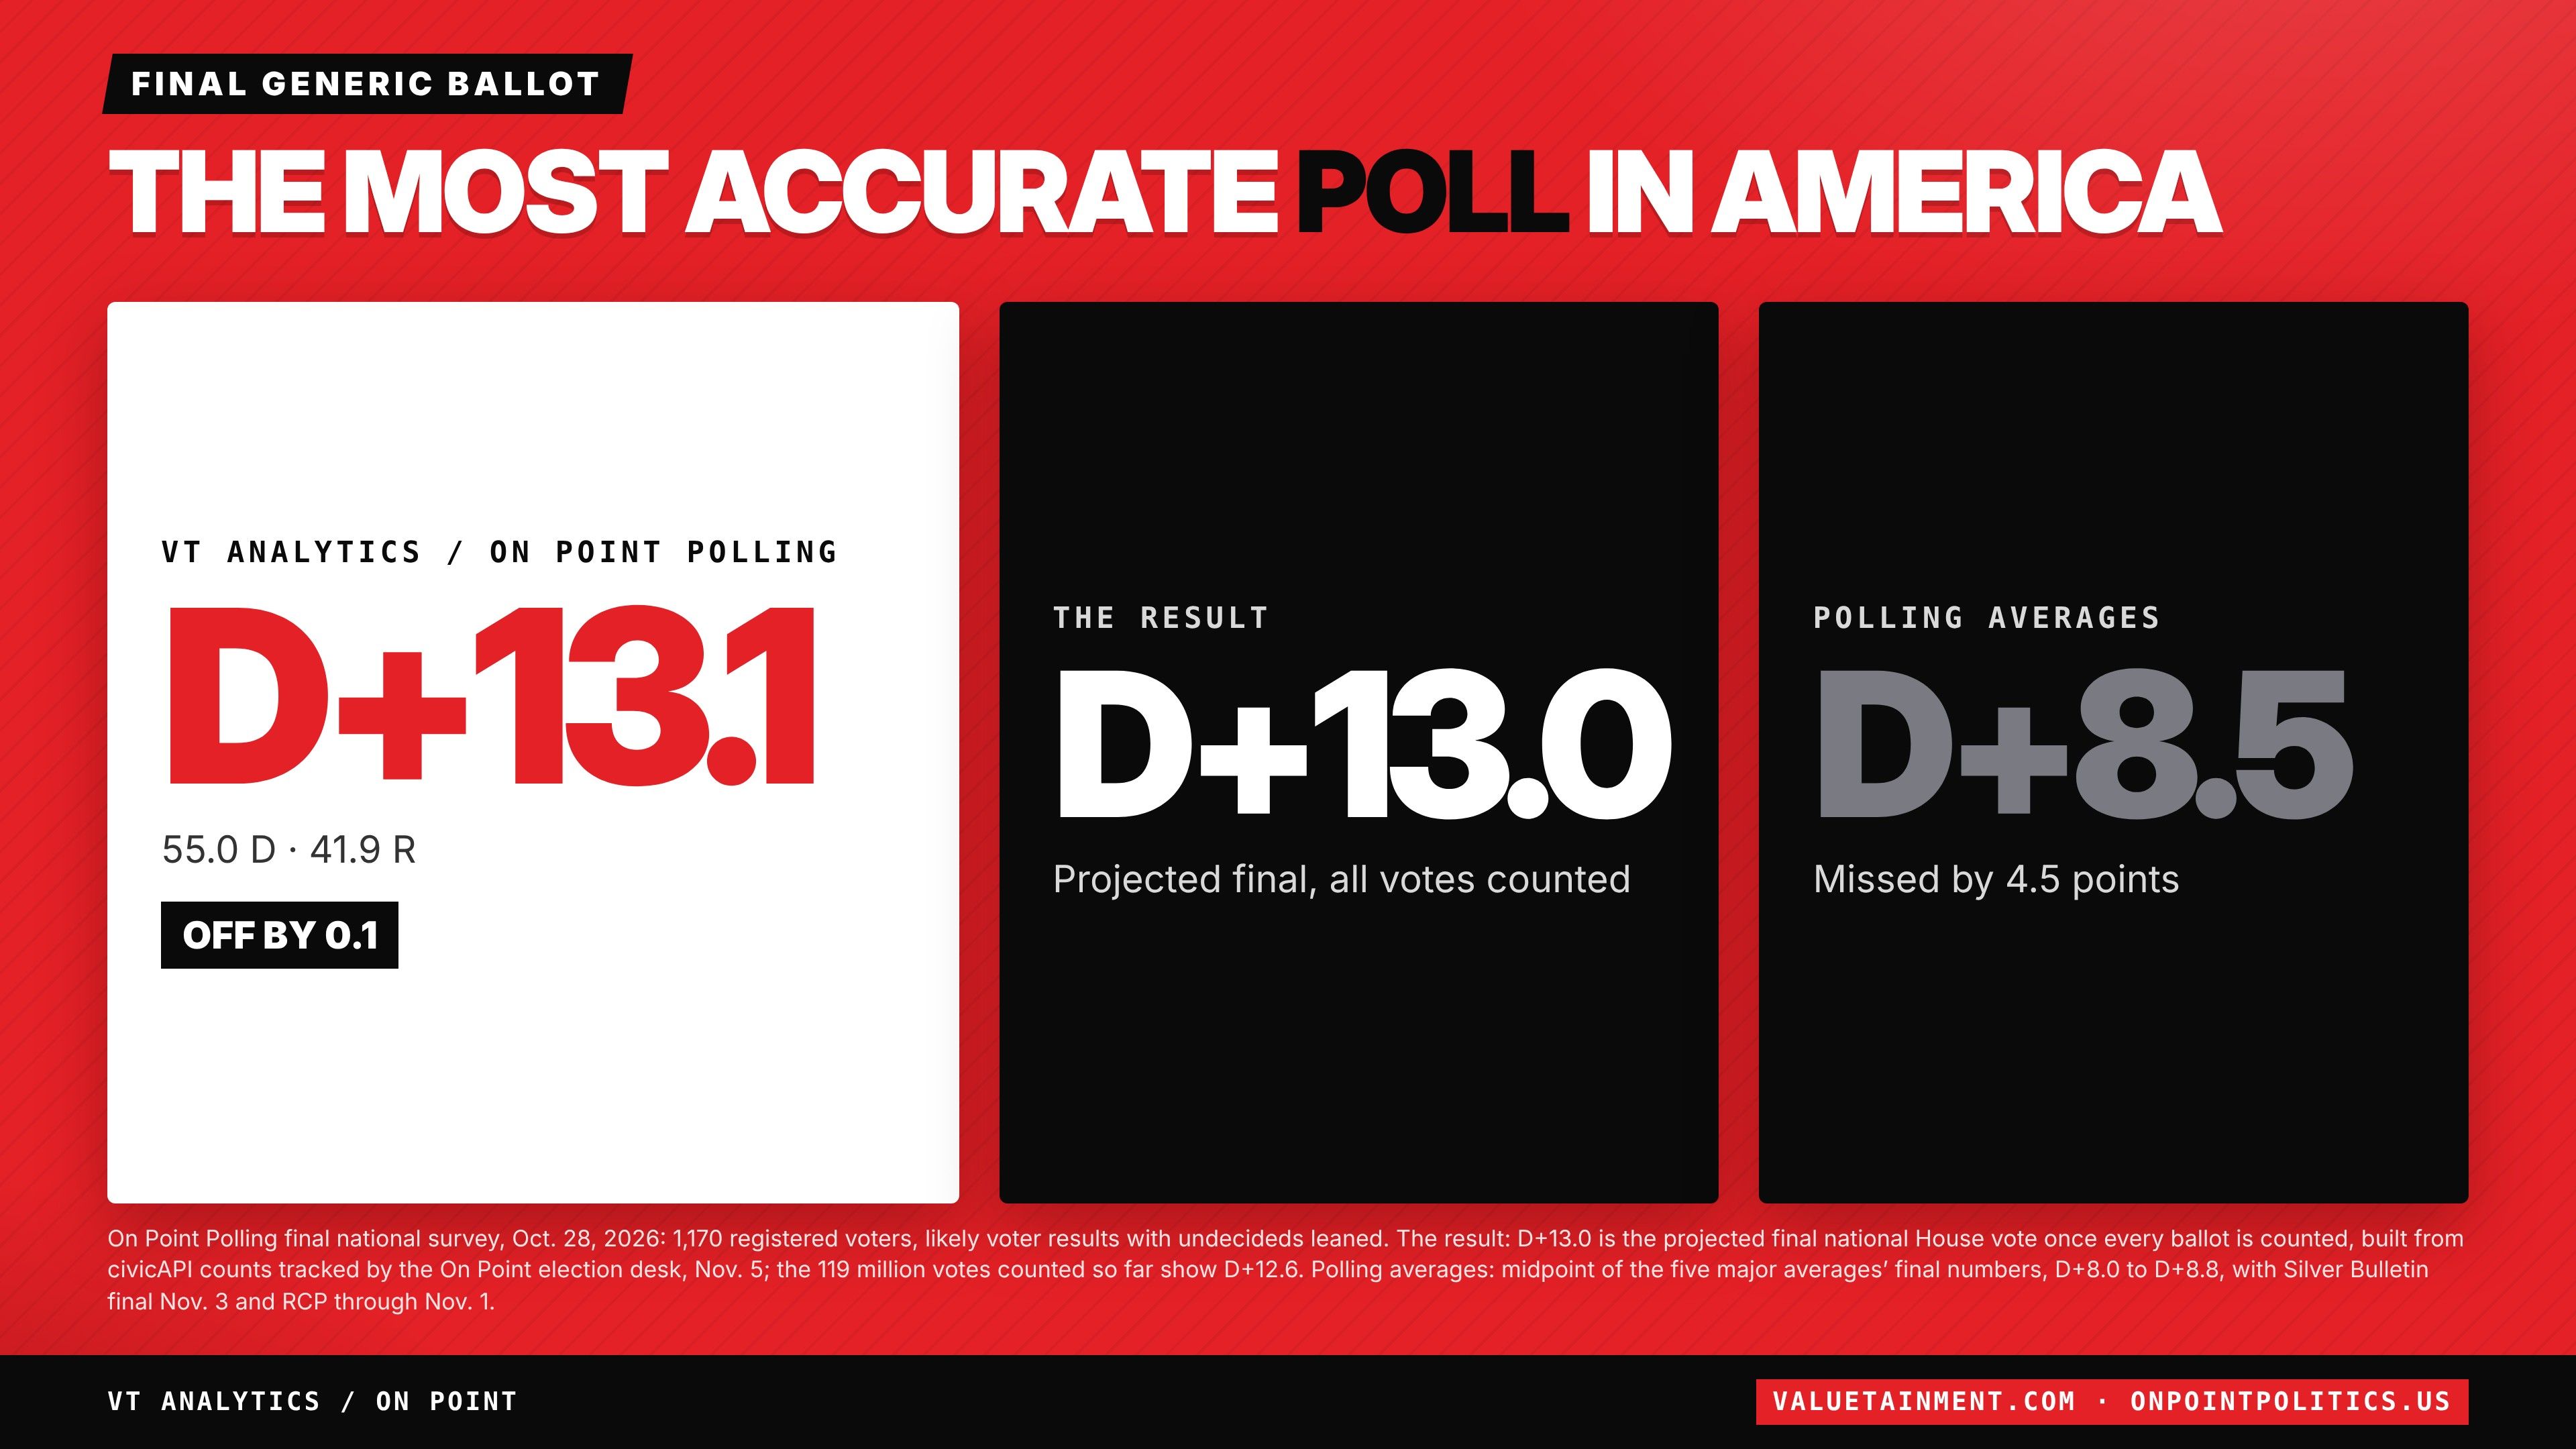
The most accurate pollster
D +13.1 on the final generic ballot. The result: D +13.0.
On Point Polling's final national survey, fielded October 28 among 1,170 registered voters. The polling averages finished near D +8.5.
On Point Polling final national poll
55.0 D · 41.9 R
Off by 0.1The result
Projected final, all votes counted
Polling averages
Missed by 4.5 points
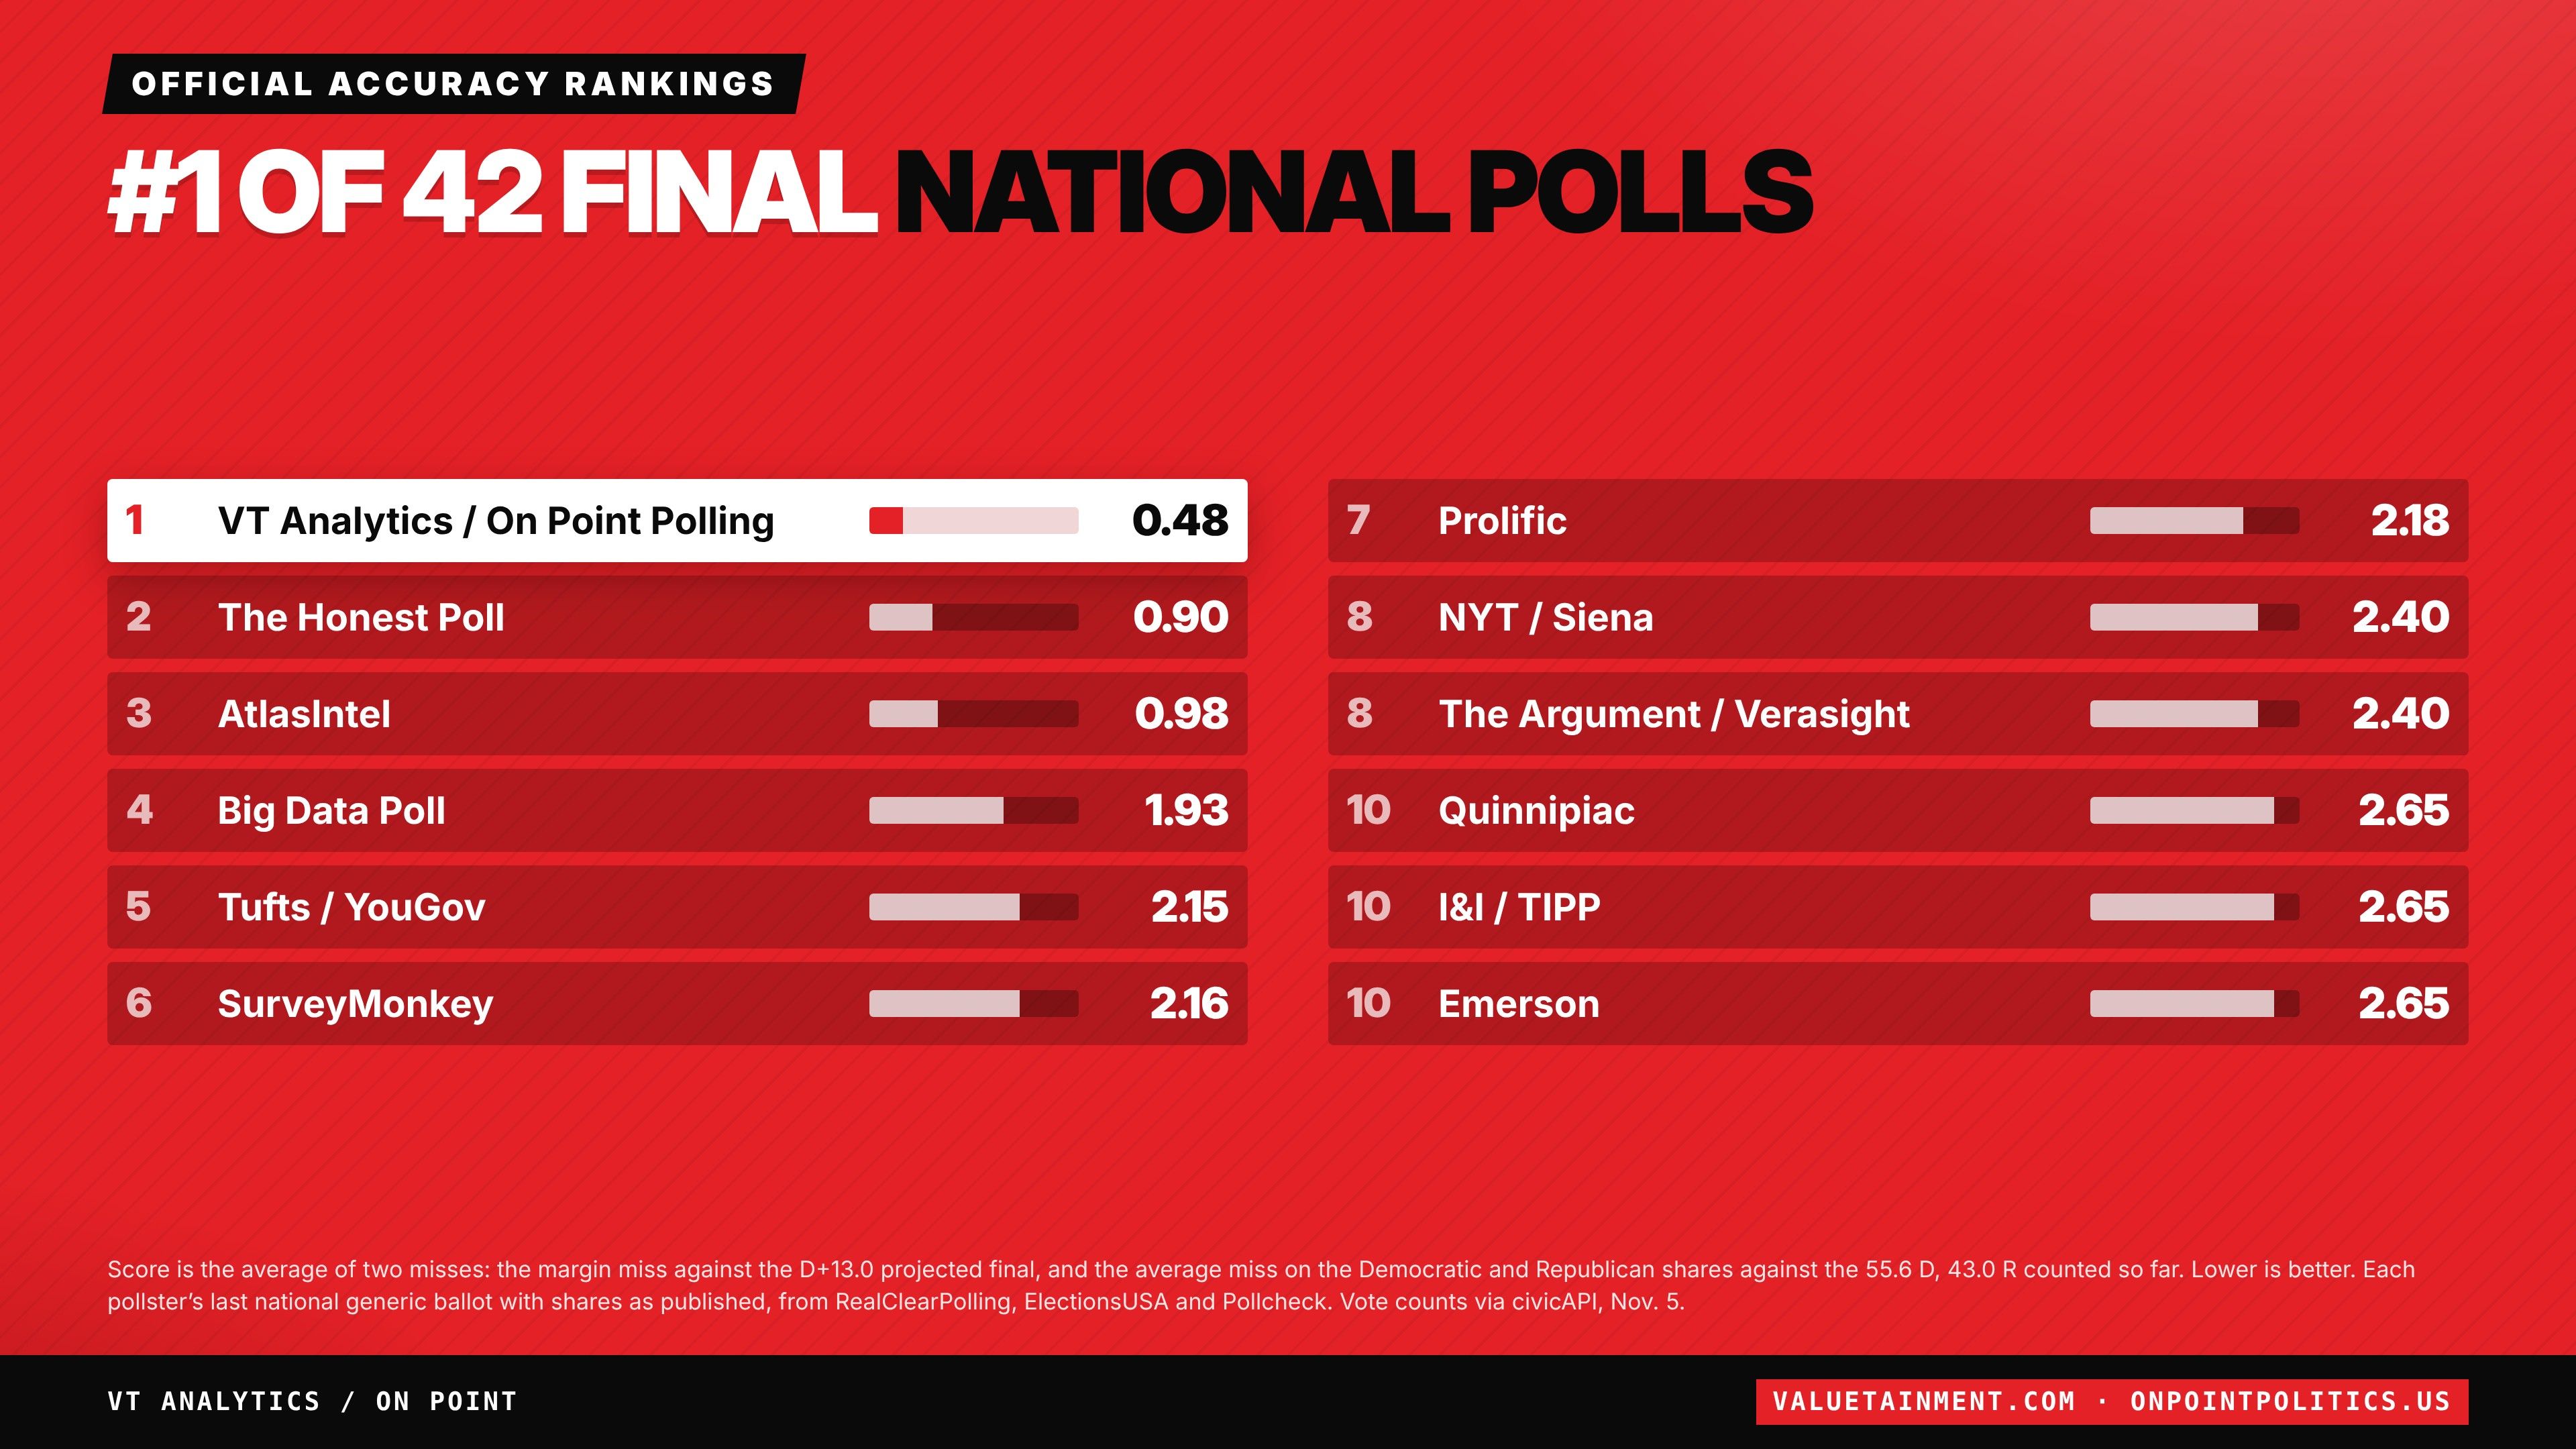
Every final national poll, ranked
42 pollsters| Rank | Pollster | Final poll | Margin miss | Score |
|---|---|---|---|---|
| 1 | VT Analytics / On Point Polling | D +13.1 | 0.1 | 0.48 |
| 2 | The Honest Poll | D +13 | 0.0 | 0.90 |
| 3 | AtlasIntel | D +14.1 | 1.1 | 0.98 |
| 4 | Big Data Poll | D +12.3 | 0.7 | 1.93 |
| 5 | Tufts / YouGov | D +12 | 1.0 | 2.15 |
| 6 | SurveyMonkey | D +10 | 3.0 | 2.16 |
| 7 | Prolific | D +10.7 | 2.3 | 2.18 |
| 8 | NYT / Siena | D +11 | 2.0 | 2.40 |
| 8 | The Argument / Verasight | D +11 | 2.0 | 2.40 |
| 10 | Quinnipiac | D +12 | 1.0 | 2.65 |
| 10 | I&I / TIPP | D +10 | 3.0 | 2.65 |
| 10 | Emerson | D +10 | 3.0 | 2.65 |
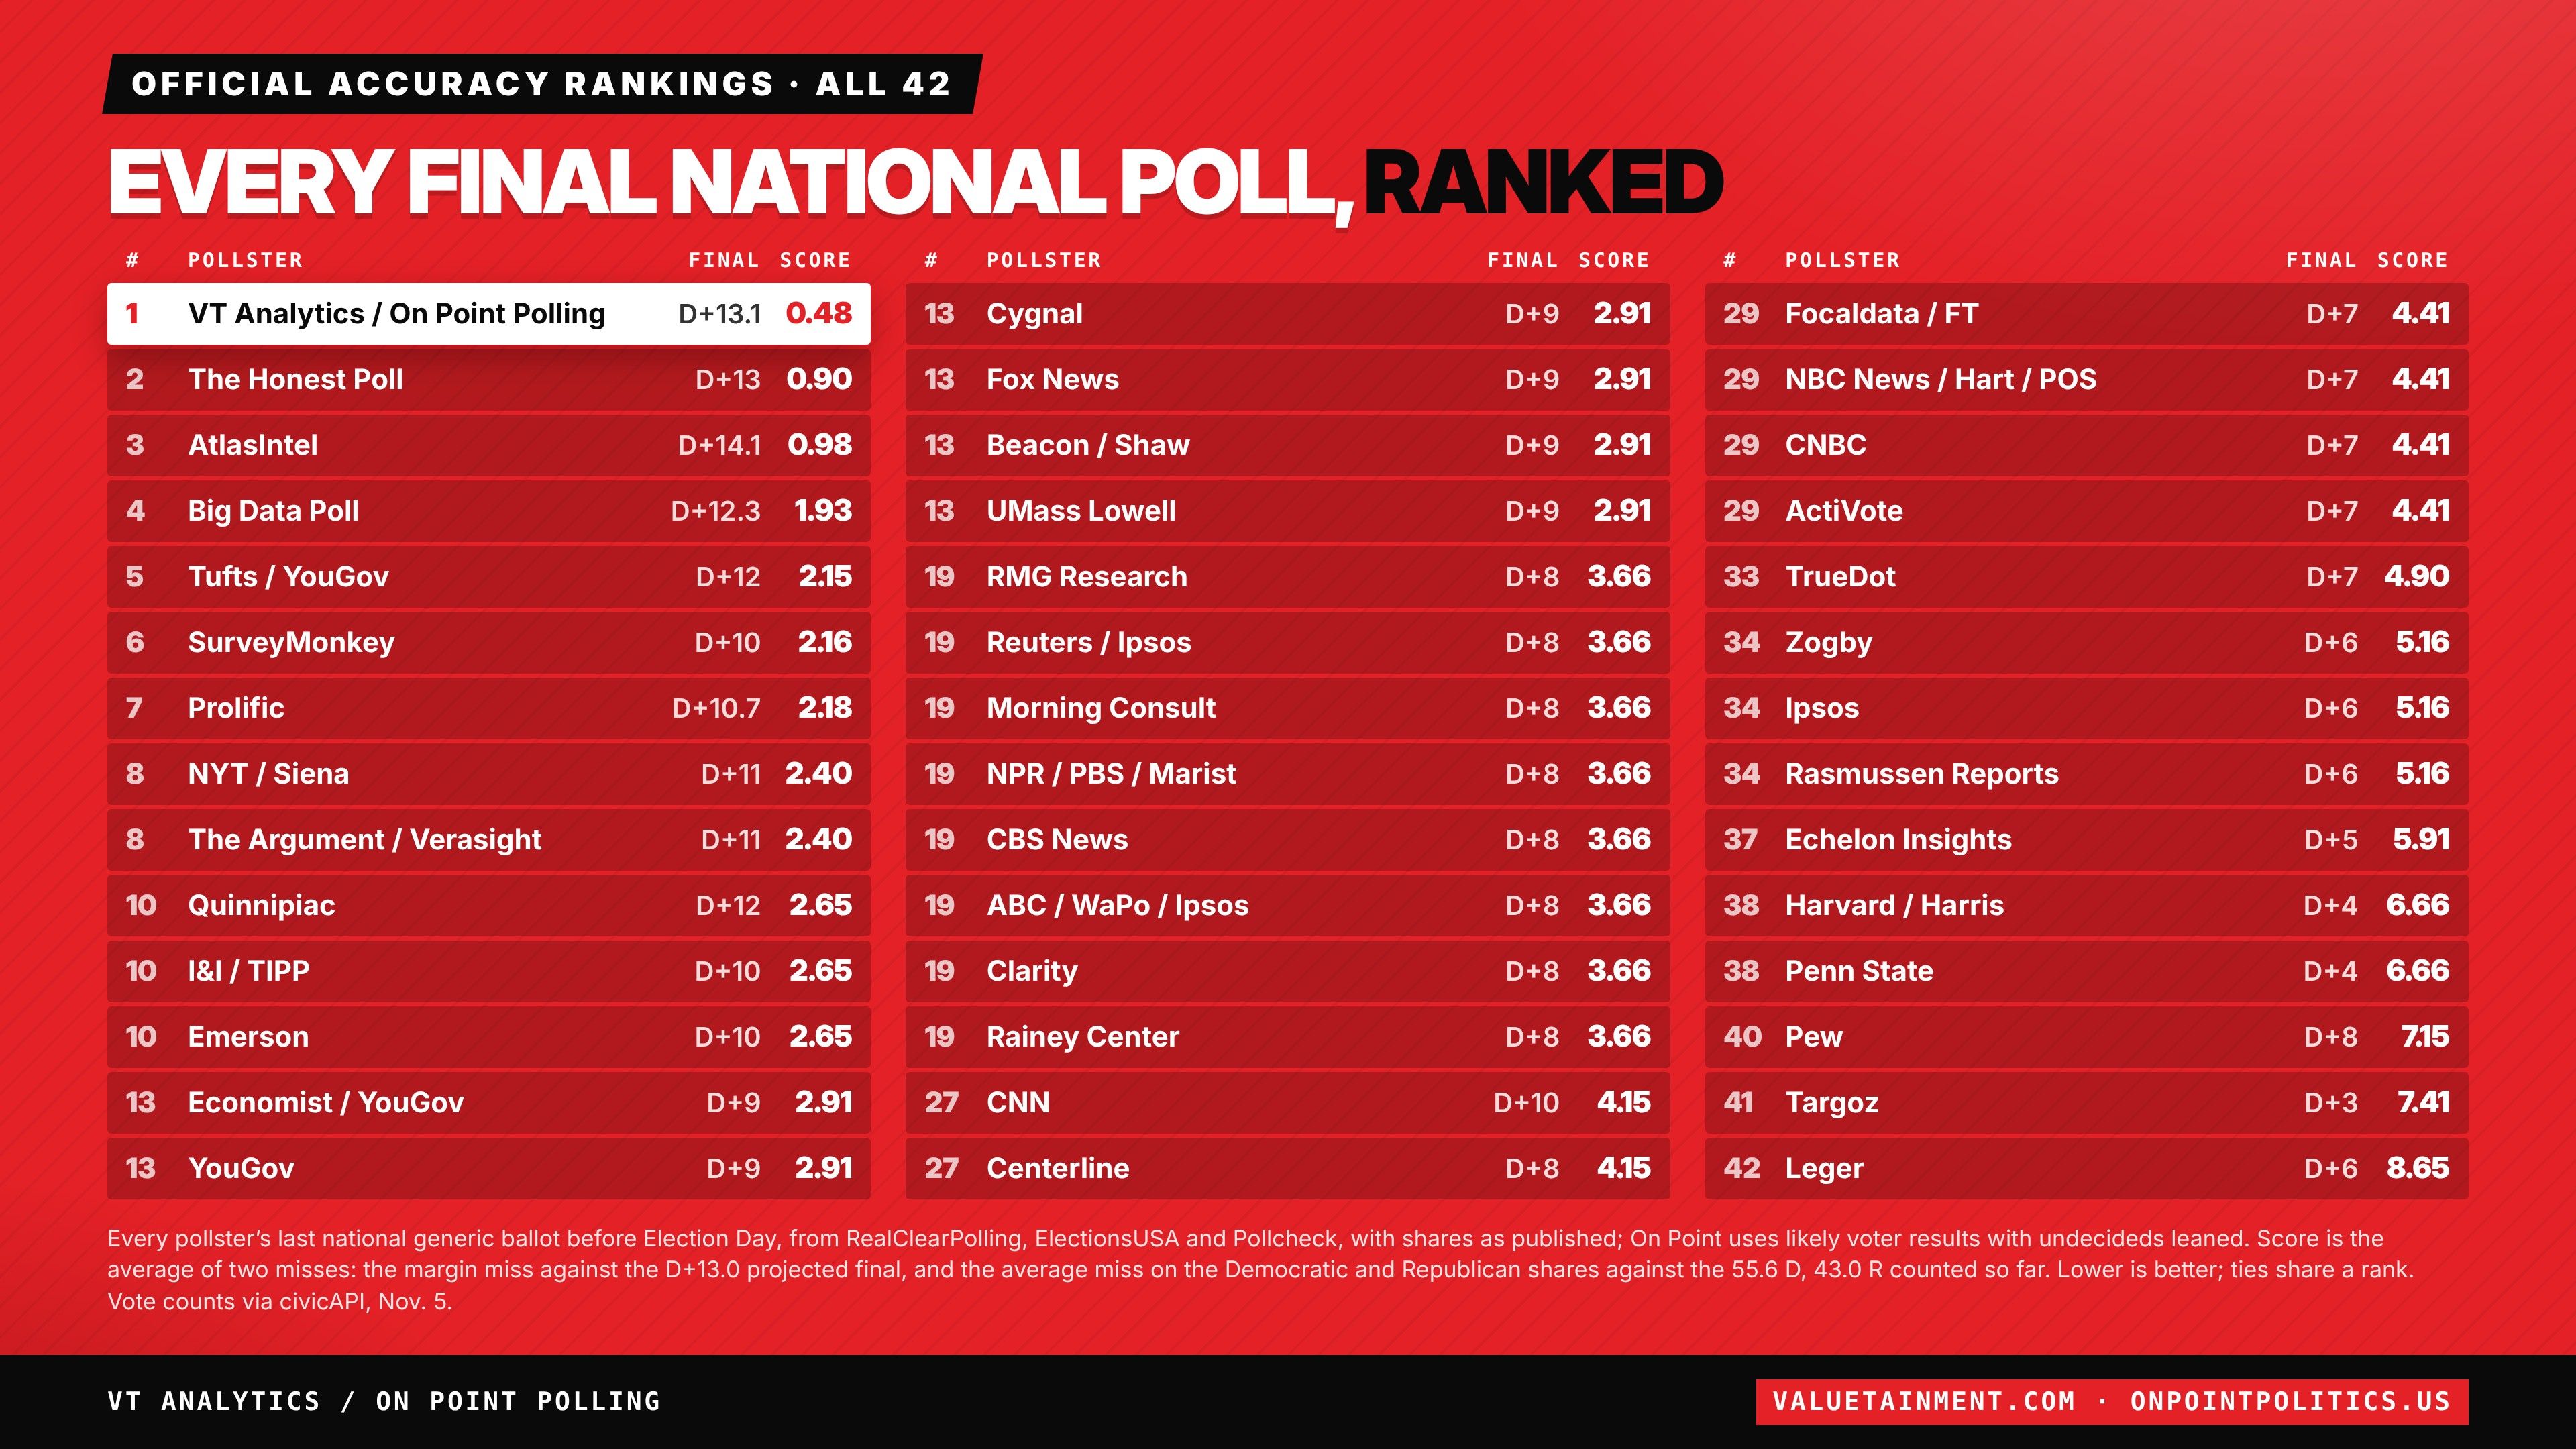
All 42 final national polls
| Rank | Pollster | Final poll | Margin miss | Score |
|---|---|---|---|---|
| 1 | VT Analytics / On Point Polling | D +13.1 | 0.1 | 0.48 |
| 2 | The Honest Poll | D +13 | 0.0 | 0.90 |
| 3 | AtlasIntel | D +14.1 | 1.1 | 0.98 |
| 4 | Big Data Poll | D +12.3 | 0.7 | 1.93 |
| 5 | Tufts / YouGov | D +12 | 1.0 | 2.15 |
| 6 | SurveyMonkey | D +10 | 3.0 | 2.16 |
| 7 | Prolific | D +10.7 | 2.3 | 2.18 |
| 8 | NYT / Siena | D +11 | 2.0 | 2.40 |
| 8 | The Argument / Verasight | D +11 | 2.0 | 2.40 |
| 10 | Quinnipiac | D +12 | 1.0 | 2.65 |
| 10 | I&I / TIPP | D +10 | 3.0 | 2.65 |
| 10 | Emerson | D +10 | 3.0 | 2.65 |
| 13 | Economist / YouGov | D +9 | 4.0 | 2.91 |
| 13 | YouGov | D +9 | 4.0 | 2.91 |
| 13 | Cygnal | D +9 | 4.0 | 2.91 |
| 13 | Fox News | D +9 | 4.0 | 2.91 |
| 13 | Beacon / Shaw | D +9 | 4.0 | 2.91 |
| 13 | UMass Lowell | D +9 | 4.0 | 2.91 |
| 19 | RMG Research | D +8 | 5.0 | 3.66 |
| 19 | Reuters / Ipsos | D +8 | 5.0 | 3.66 |
| 19 | Morning Consult | D +8 | 5.0 | 3.66 |
| 19 | NPR / PBS / Marist | D +8 | 5.0 | 3.66 |
| 19 | CBS News | D +8 | 5.0 | 3.66 |
| 19 | ABC / WaPo / Ipsos | D +8 | 5.0 | 3.66 |
| 19 | Clarity | D +8 | 5.0 | 3.66 |
| 19 | Rainey Center | D +8 | 5.0 | 3.66 |
| 27 | CNN | D +10 | 3.0 | 4.15 |
| 27 | Centerline | D +8 | 5.0 | 4.15 |
| 29 | Focaldata / FT | D +7 | 6.0 | 4.41 |
| 29 | NBC News / Hart / POS | D +7 | 6.0 | 4.41 |
| 29 | CNBC | D +7 | 6.0 | 4.41 |
| 29 | ActiVote | D +7 | 6.0 | 4.41 |
| 33 | TrueDot | D +7 | 6.0 | 4.90 |
| 34 | Zogby | D +6 | 7.0 | 5.16 |
| 34 | Ipsos | D +6 | 7.0 | 5.16 |
| 34 | Rasmussen Reports | D +6 | 7.0 | 5.16 |
| 37 | Echelon Insights | D +5 | 8.0 | 5.91 |
| 38 | Harvard / Harris | D +4 | 9.0 | 6.66 |
| 38 | Penn State | D +4 | 9.0 | 6.66 |
| 40 | Pew | D +8 | 5.0 | 7.15 |
| 41 | Targoz | D +3 | 10.0 | 7.41 |
| 42 | Leger | D +6 | 7.0 | 8.65 |
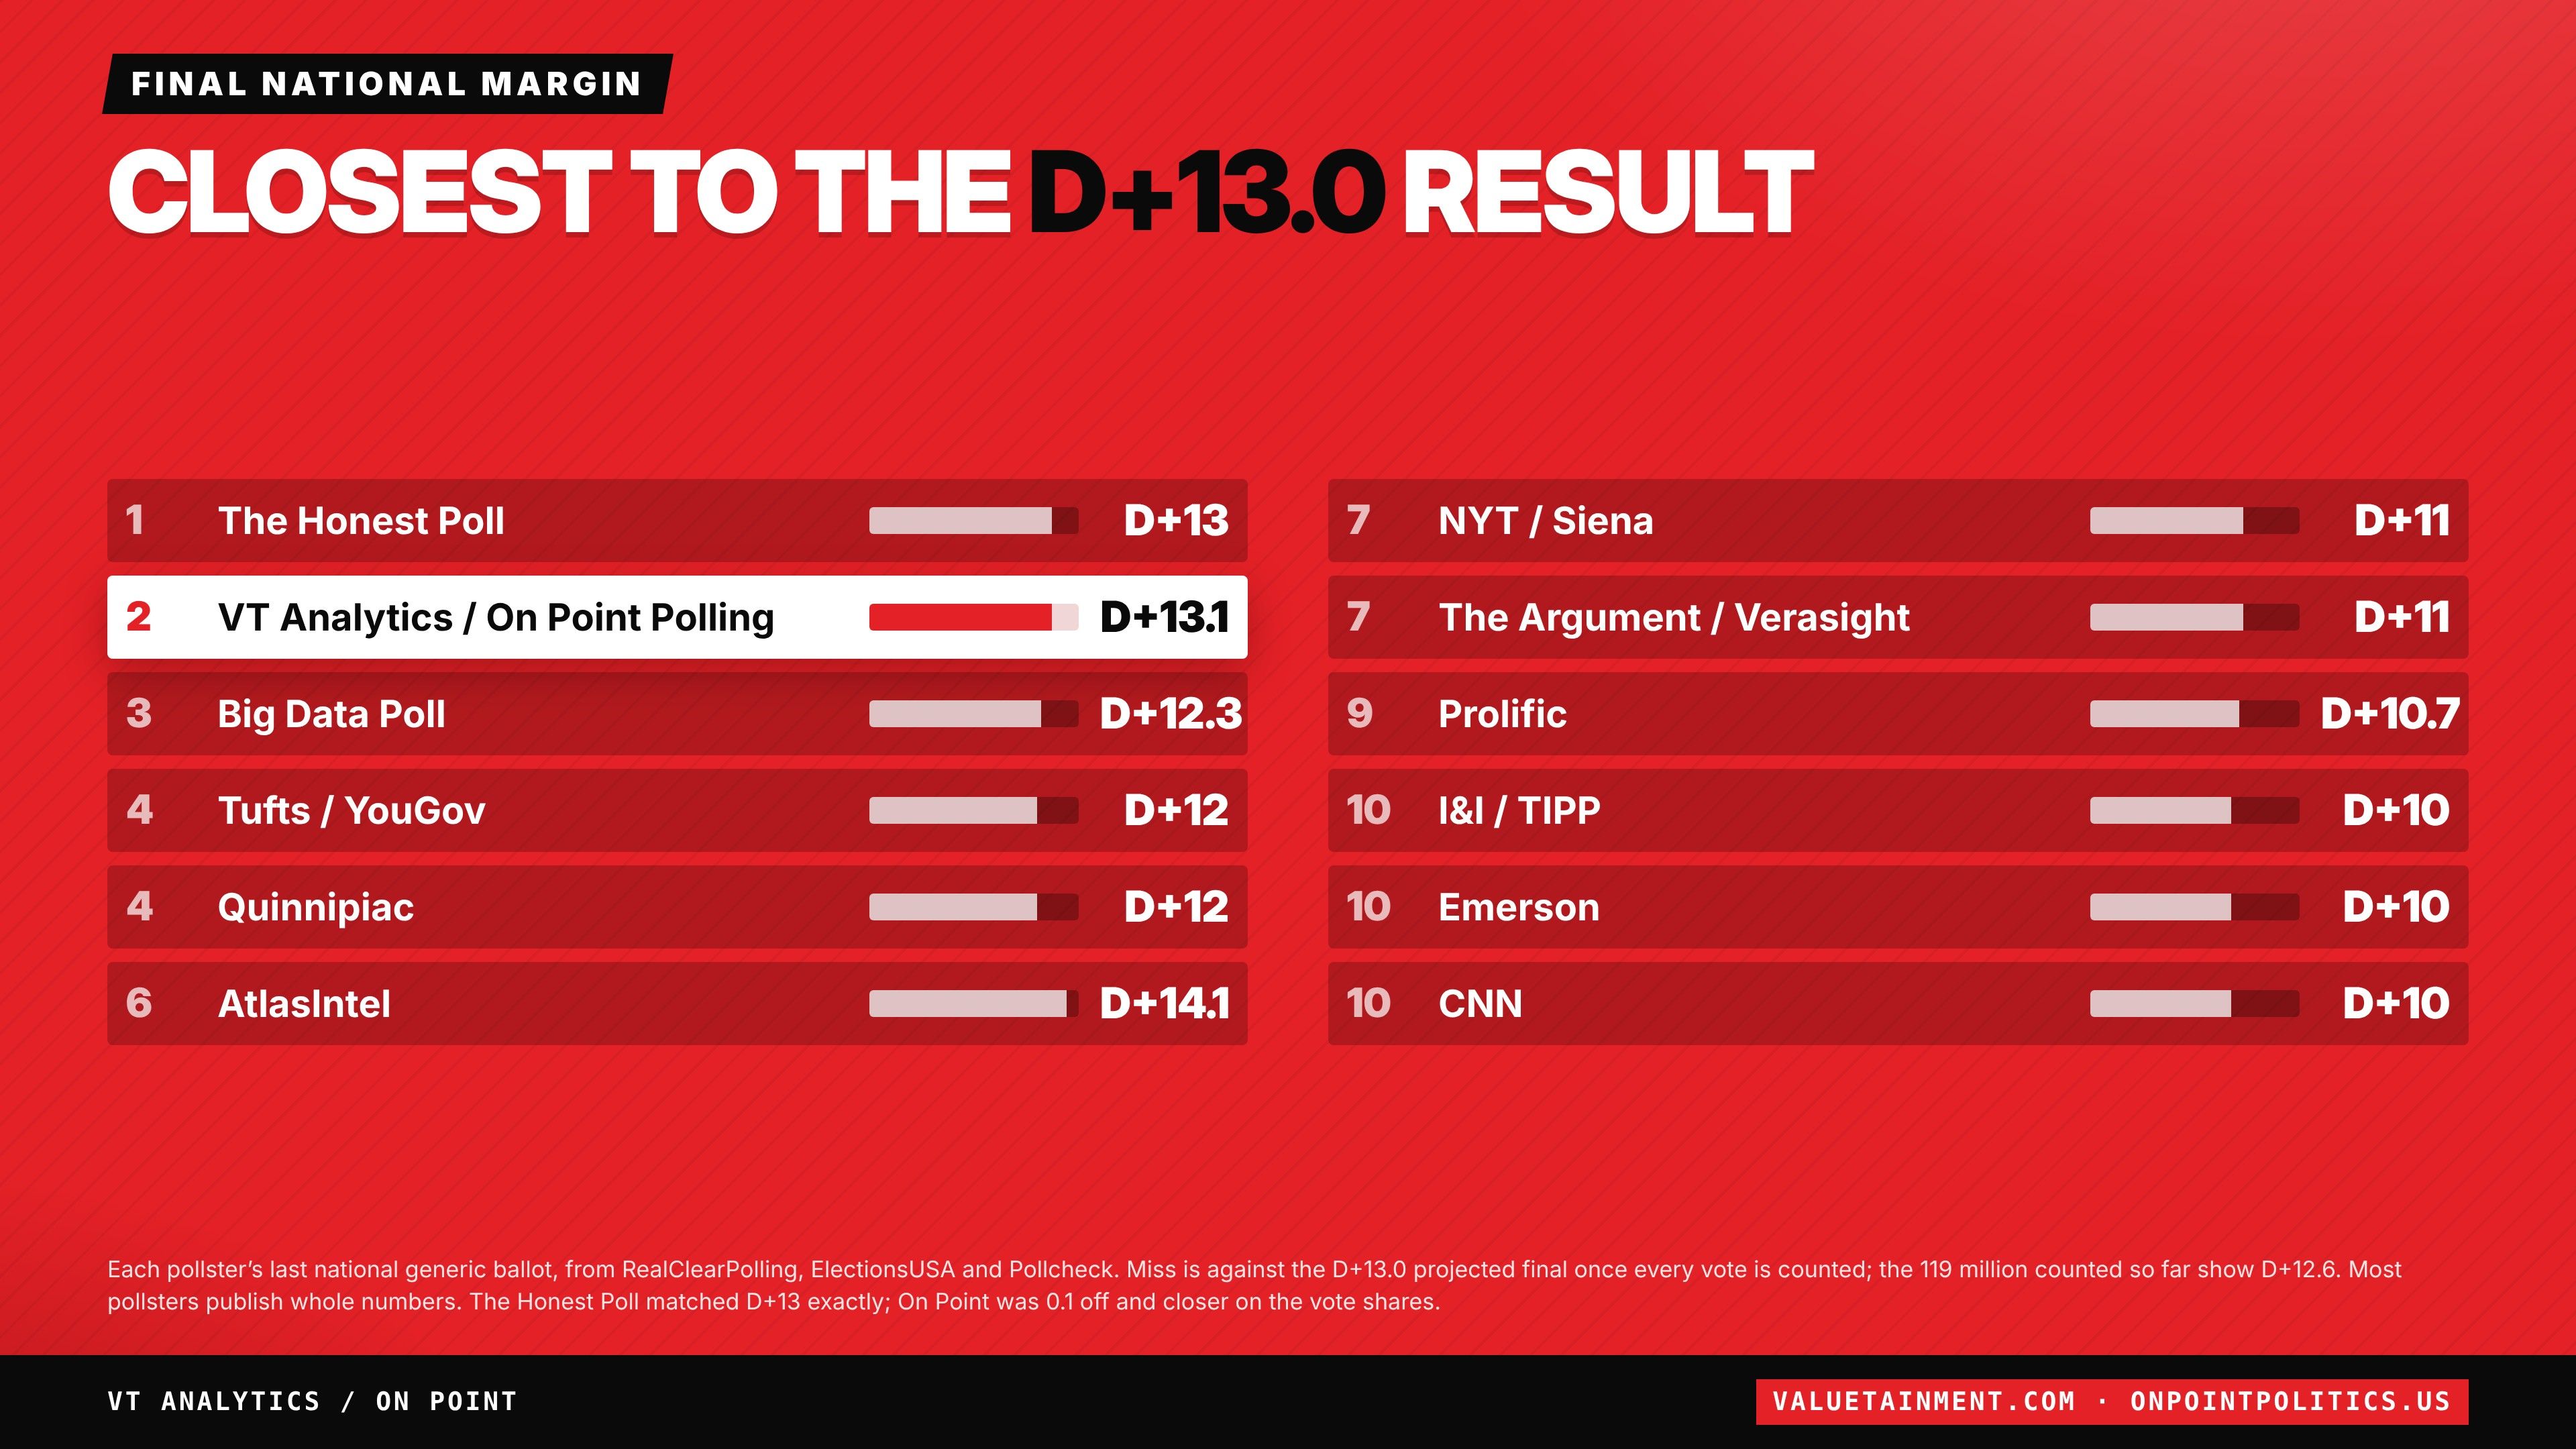
Score is the average of two misses: the margin miss against the D+13.0 projected final, and the average miss on the Democratic and Republican shares against the 55.6 D, 43.0 R counted so far. Lower is better; ties share a rank. Each pollster's last national generic ballot before Election Day with shares as published, from RealClearPolling, ElectionsUSA and Pollcheck. On Point uses its likely voter results with undecideds leaned. The margin miss alone puts The Honest Poll first at D +13 and On Point second, 0.1 off. The D +13.0 result is the projected final once every vote is counted; the 119 million votes counted by the evening of November 5 show D +12.6. The full ranking has its own page.
Against every other forecast
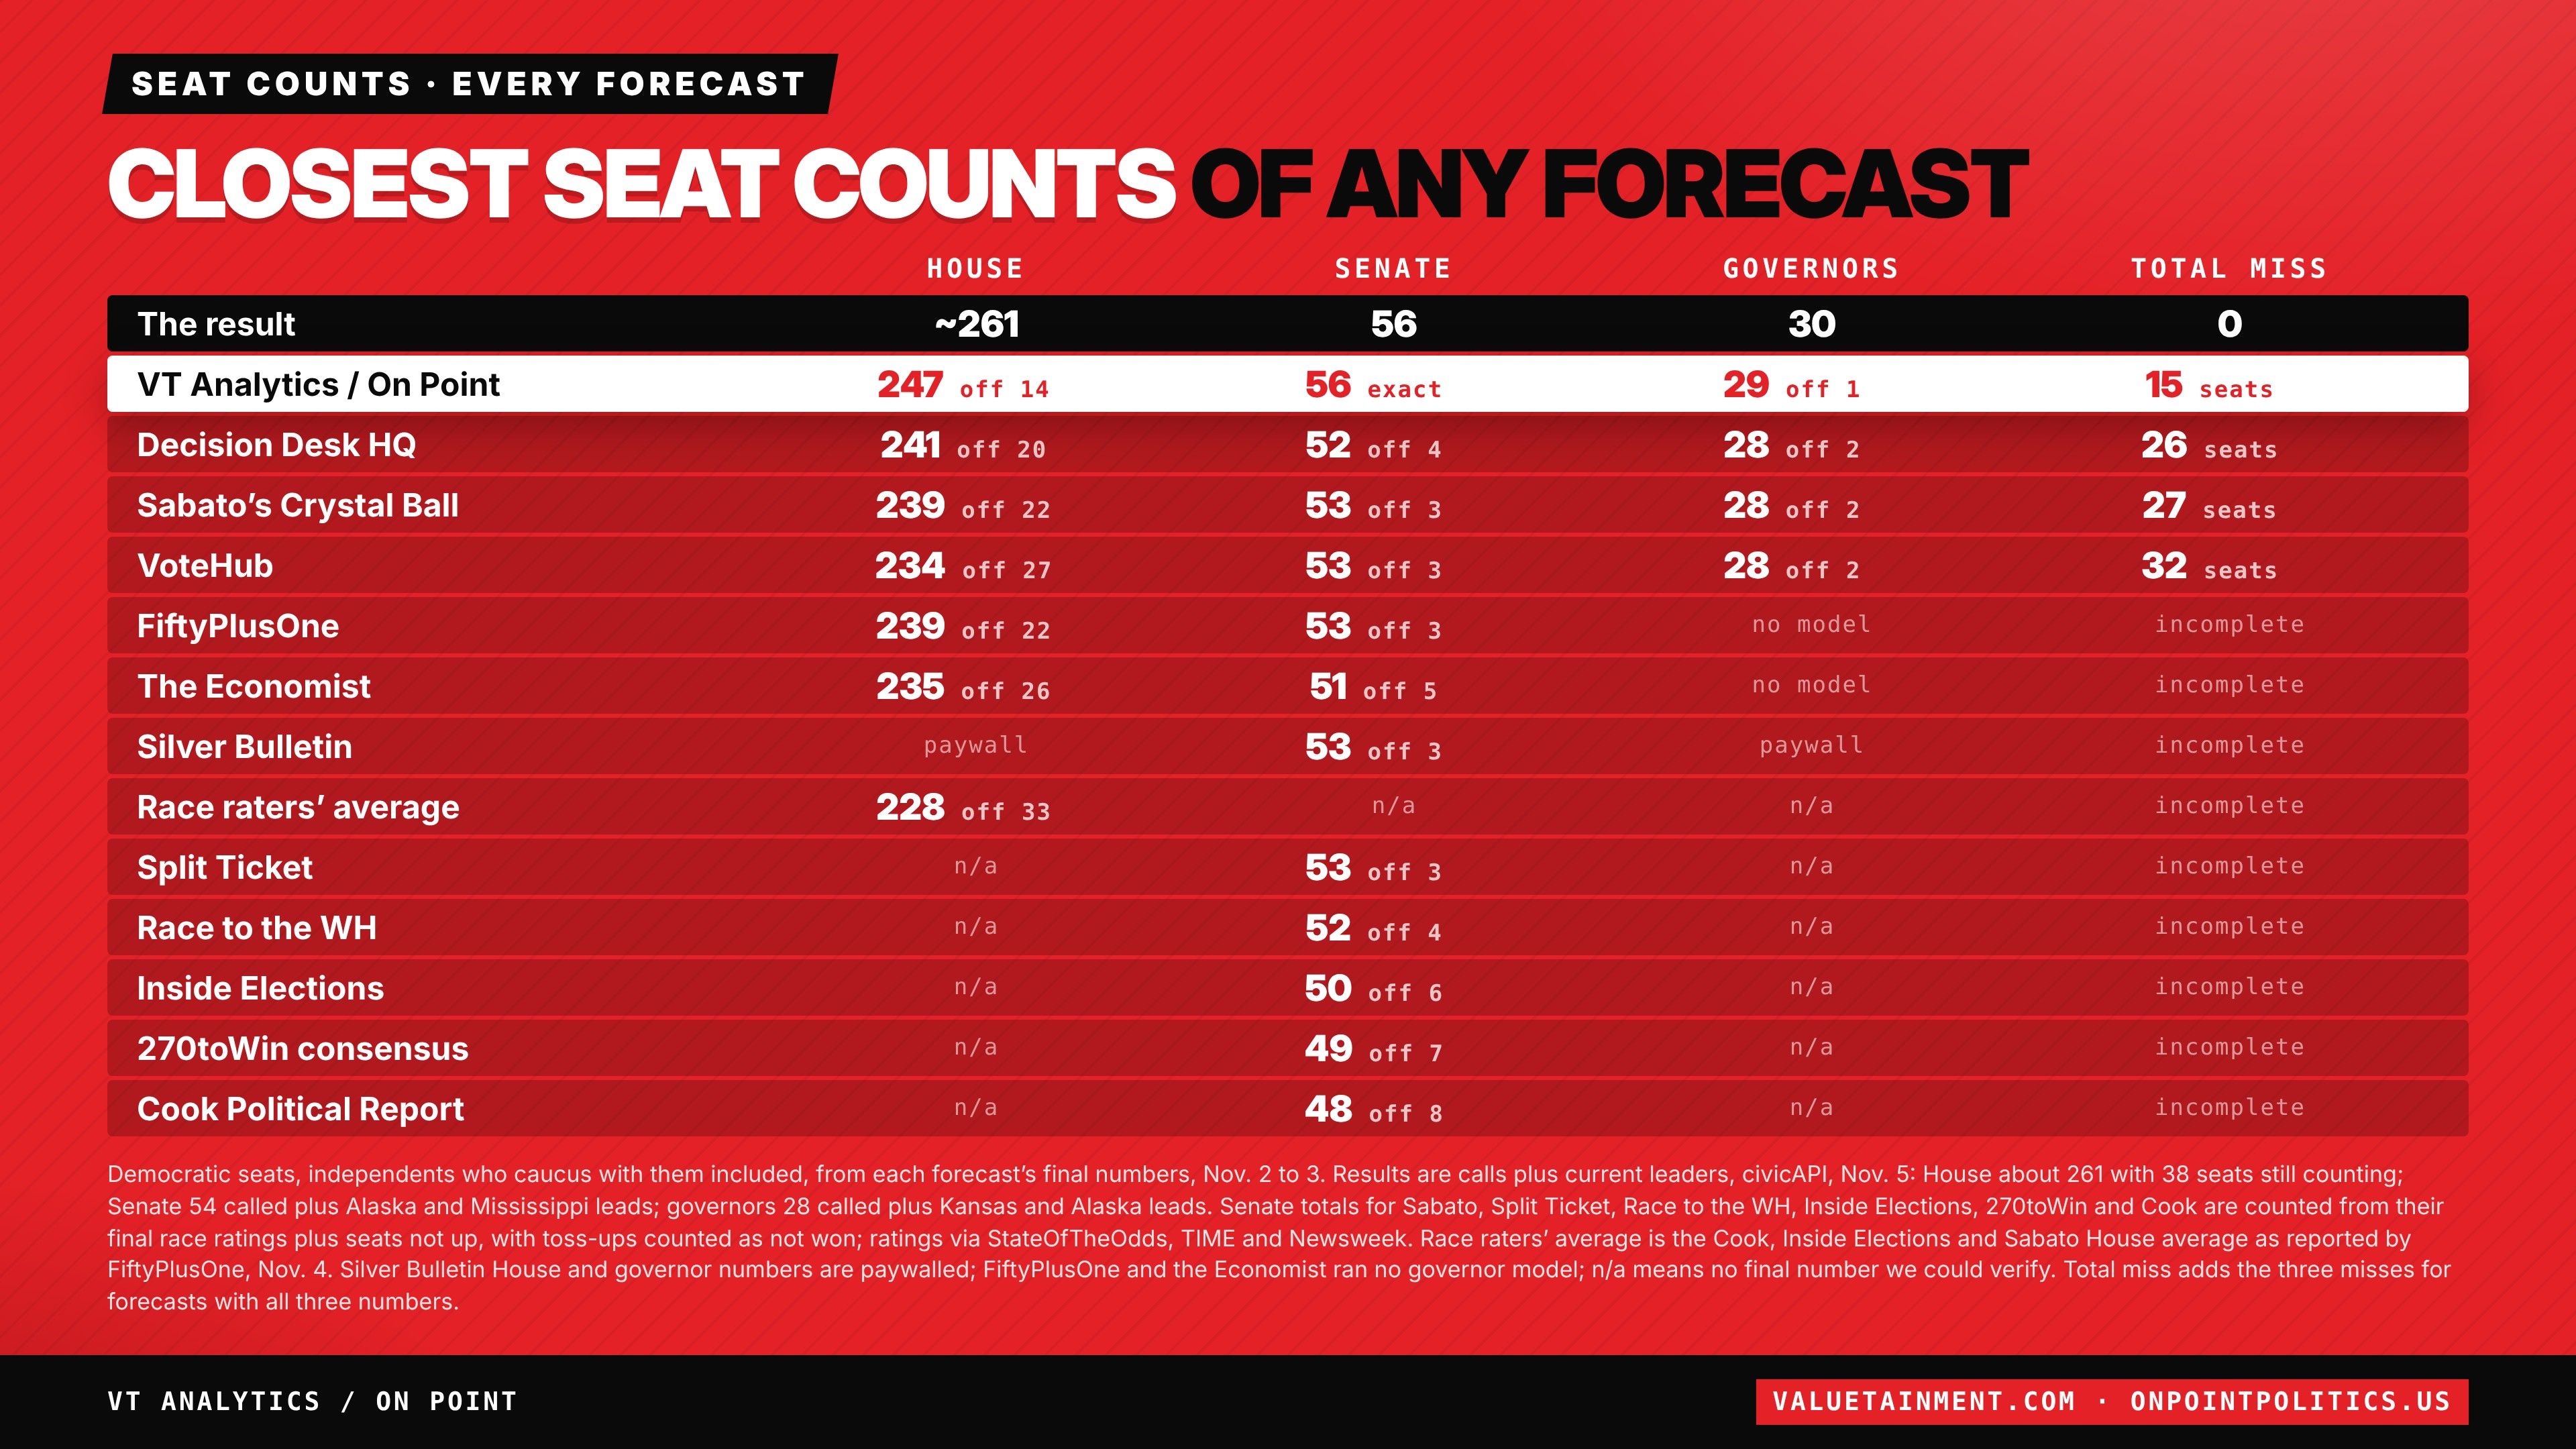
The closest seat counts of any forecast
Every forecast that published final seat numbers, against calls and current leaders as of the evening of November 5. That is a day later than the count in the race tables below, so a few leads differ.
| Forecast | House | Senate | Governors | Total miss |
|---|---|---|---|---|
| The result | about 261 | 56 | 30 | 0 |
| VT Analytics / On Point | 247 off 14 | 56 exact | 29 off 1 | 15 seats |
| Decision Desk HQ | 241 off 20 | 52 off 4 | 28 off 2 | 26 seats |
| Sabato's Crystal Ball | 239 off 22 | 53 off 3 | 28 off 2 | 27 seats |
| VoteHub | 234 off 27 | 53 off 3 | 28 off 2 | 32 seats |
| FiftyPlusOne | 239 off 22 | 53 off 3 | no model | incomplete |
| The Economist | 235 off 26 | 51 off 5 | no model | incomplete |
| Silver Bulletin | paywall | 53 off 3 | paywall | incomplete |
| Race raters' average | 228 off 33 | no number | no number | incomplete |
| Split Ticket | no number | 53 off 3 | no number | incomplete |
| Race to the WH | no number | 52 off 4 | no number | incomplete |
| Inside Elections | no number | 50 off 6 | no number | incomplete |
| 270toWin consensus | no number | 49 off 7 | no number | incomplete |
| Cook Political Report | no number | 48 off 8 | no number | incomplete |
Democratic seats, independents who caucus with them included, from each forecast's final numbers, November 2 to 3. Results are calls plus current leaders: House about 261 with 38 seats still counting; Senate 54 called plus the Alaska and Mississippi leaders; governors 28 called plus the Kansas and Alaska leaders. Senate totals for Sabato, Split Ticket, Race to the WH, Inside Elections, 270toWin and Cook are counted from their final race ratings plus seats not up, with toss ups counted as not won. The race raters' average is the Cook, Inside Elections and Sabato House average. Silver Bulletin House and governor numbers are paywalled; FiftyPlusOne and the Economist ran no governor model.
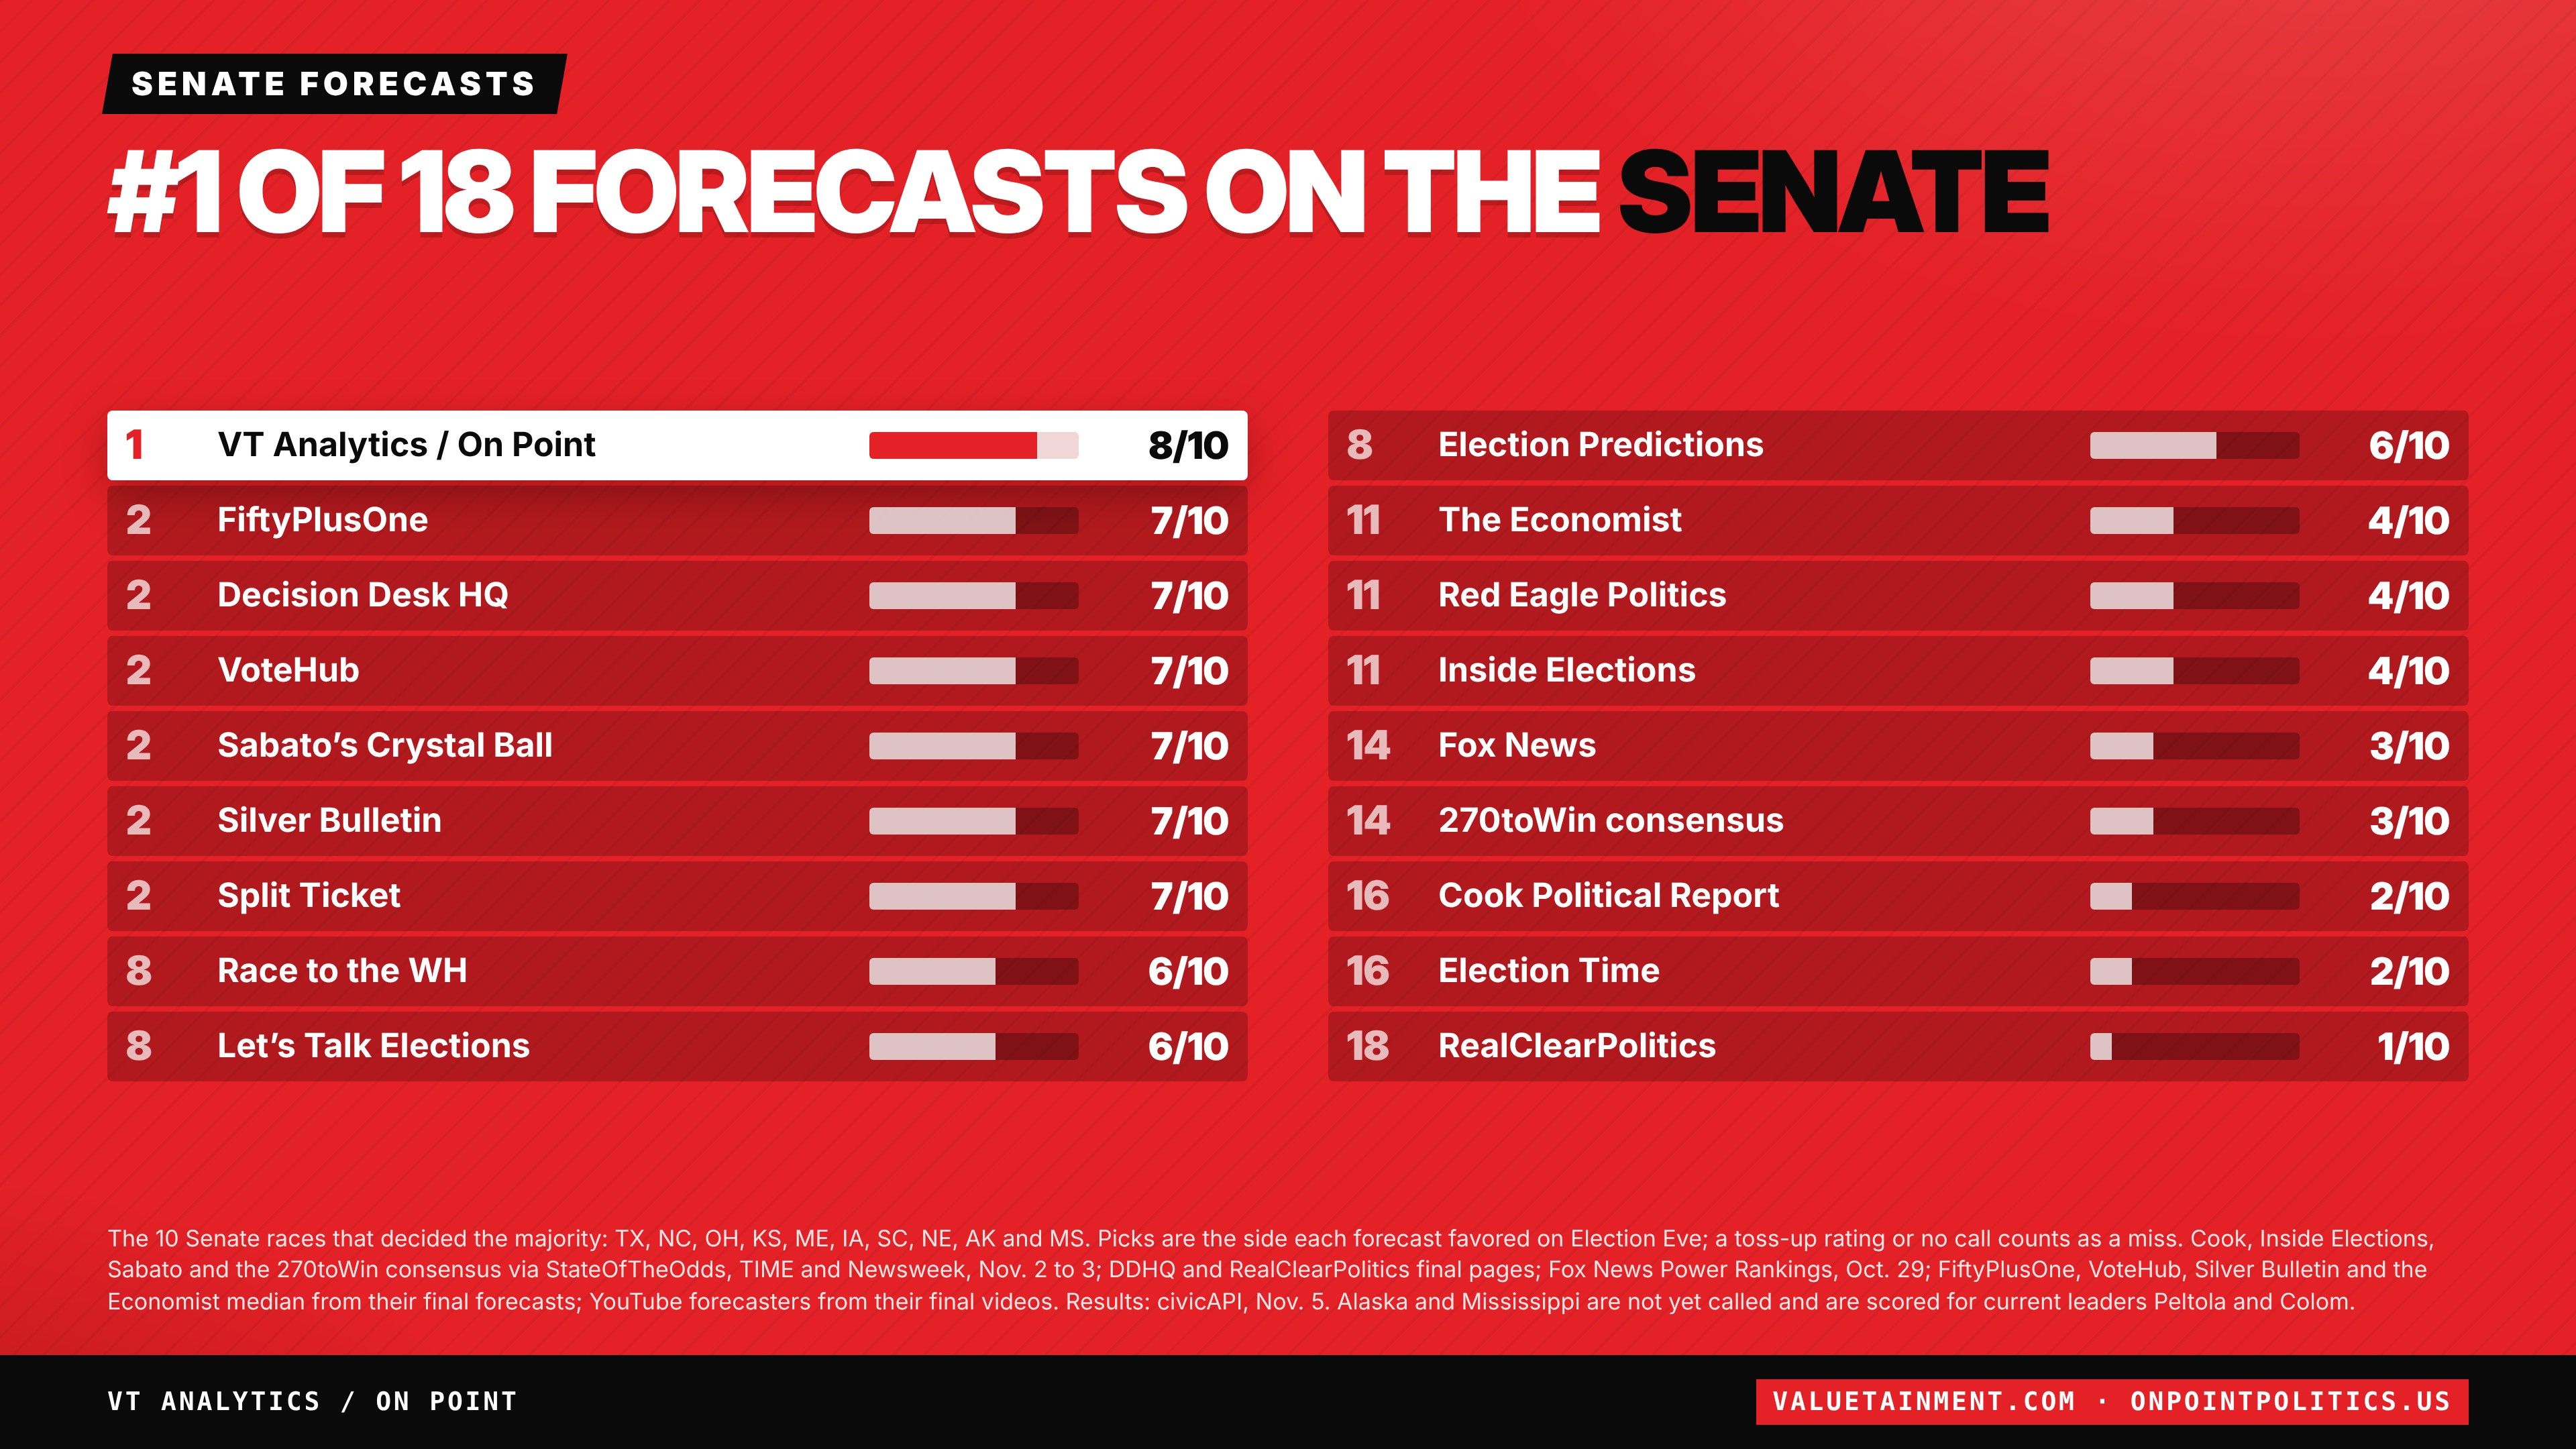
The 10 Senate races that decided the majority
18 forecasts| Rank | Forecast | Right |
|---|---|---|
| 1 | VT Analytics / On Point | 8 of 10 |
| 2 | FiftyPlusOne | 7 of 10 |
| 2 | Decision Desk HQ | 7 of 10 |
| 2 | VoteHub | 7 of 10 |
| 2 | Sabato's Crystal Ball | 7 of 10 |
| 2 | Silver Bulletin | 7 of 10 |
| 2 | Split Ticket | 7 of 10 |
| 8 | Race to the WH | 6 of 10 |
| 8 | Let's Talk Elections | 6 of 10 |
| 8 | Election Predictions | 6 of 10 |
| 11 | The Economist | 4 of 10 |
| 11 | Red Eagle Politics | 4 of 10 |
| 11 | Inside Elections | 4 of 10 |
| 14 | Fox News | 3 of 10 |
| 14 | 270toWin consensus | 3 of 10 |
| 16 | Cook Political Report | 2 of 10 |
| 16 | Election Time | 2 of 10 |
| 18 | RealClearPolitics | 1 of 10 |
The 10 Senate races that decided the majority. Picks are the side each forecast favored on Election Eve; a toss up rating or no call counts as a miss. Ratings from each forecaster's final pages, maps and videos, with StateOfTheOdds, TIME and Newsweek for the rating roundups, November 2 to 3, and Fox News Power Rankings from October 29. Alaska and Mississippi were not yet called and are scored for the leaders, Peltola and Colom.
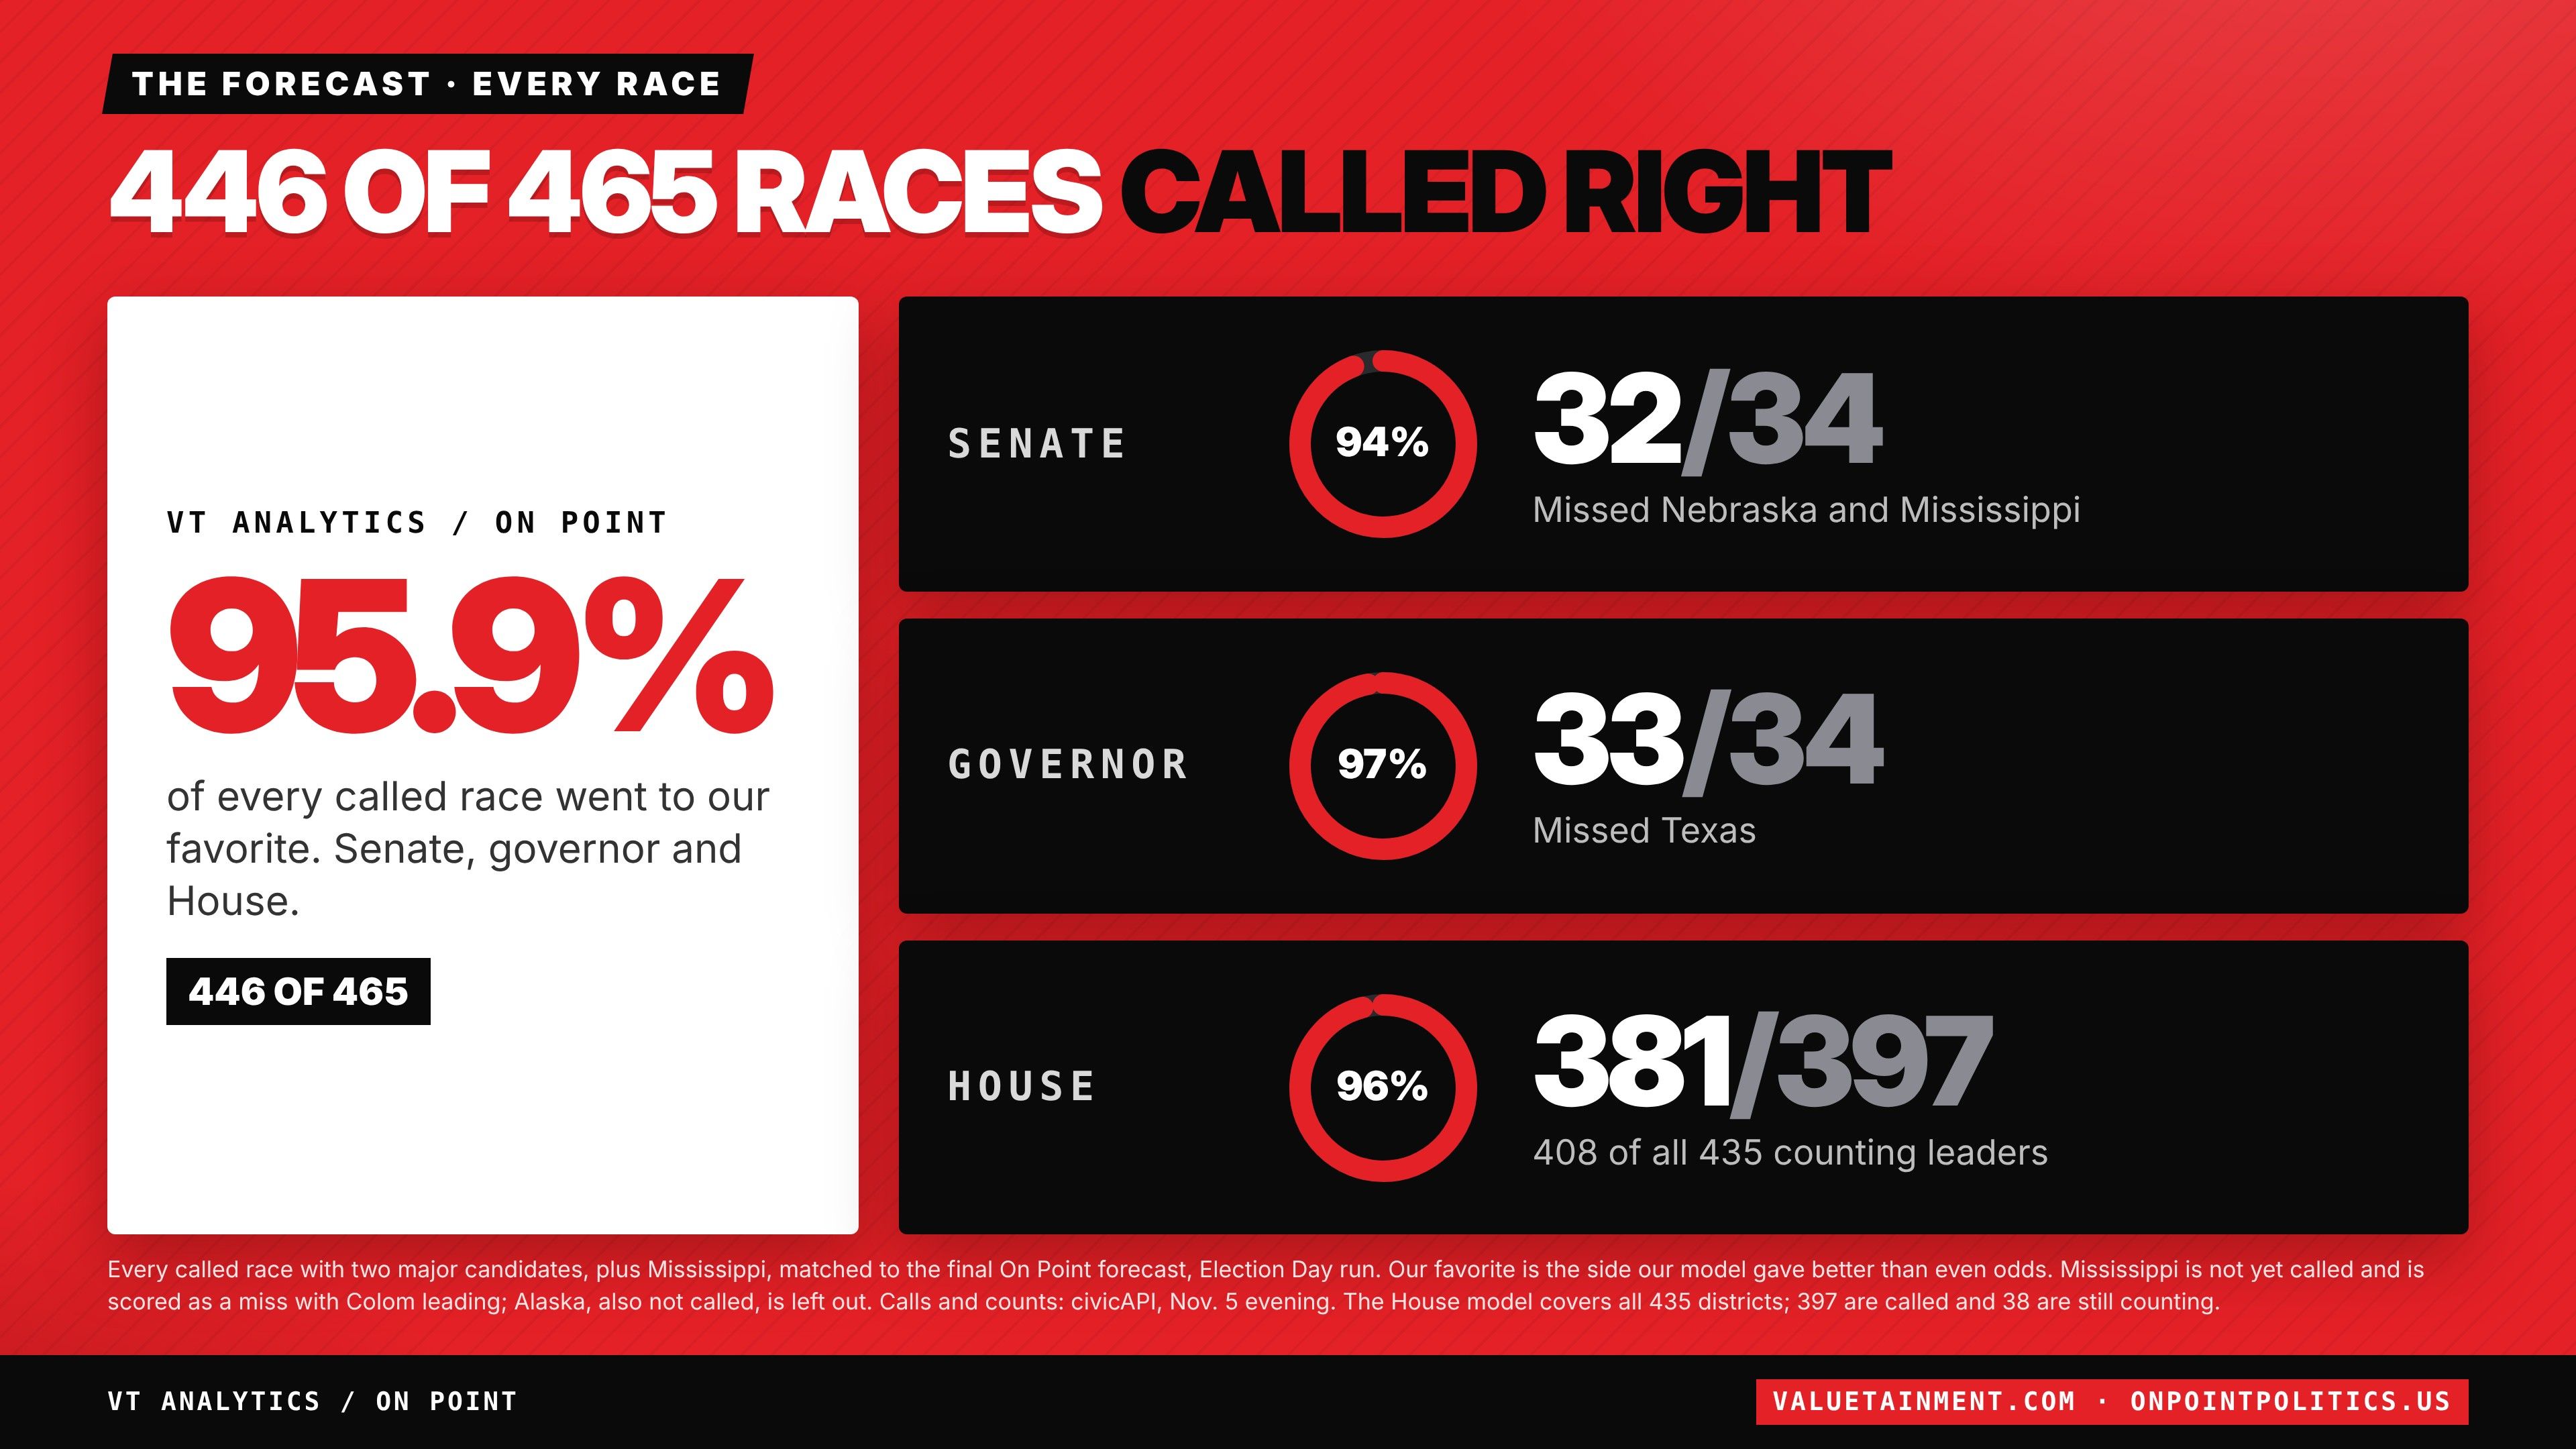
Every race with a call and two major candidates, matched to the final On Point forecast. A wrong call or a toss up counts as a miss, so Mississippi counts as a miss with Colom leading. The House model covers all 435 districts; 397 were called and 38 still counting. Count as of the evening of November 5.
What else we got right
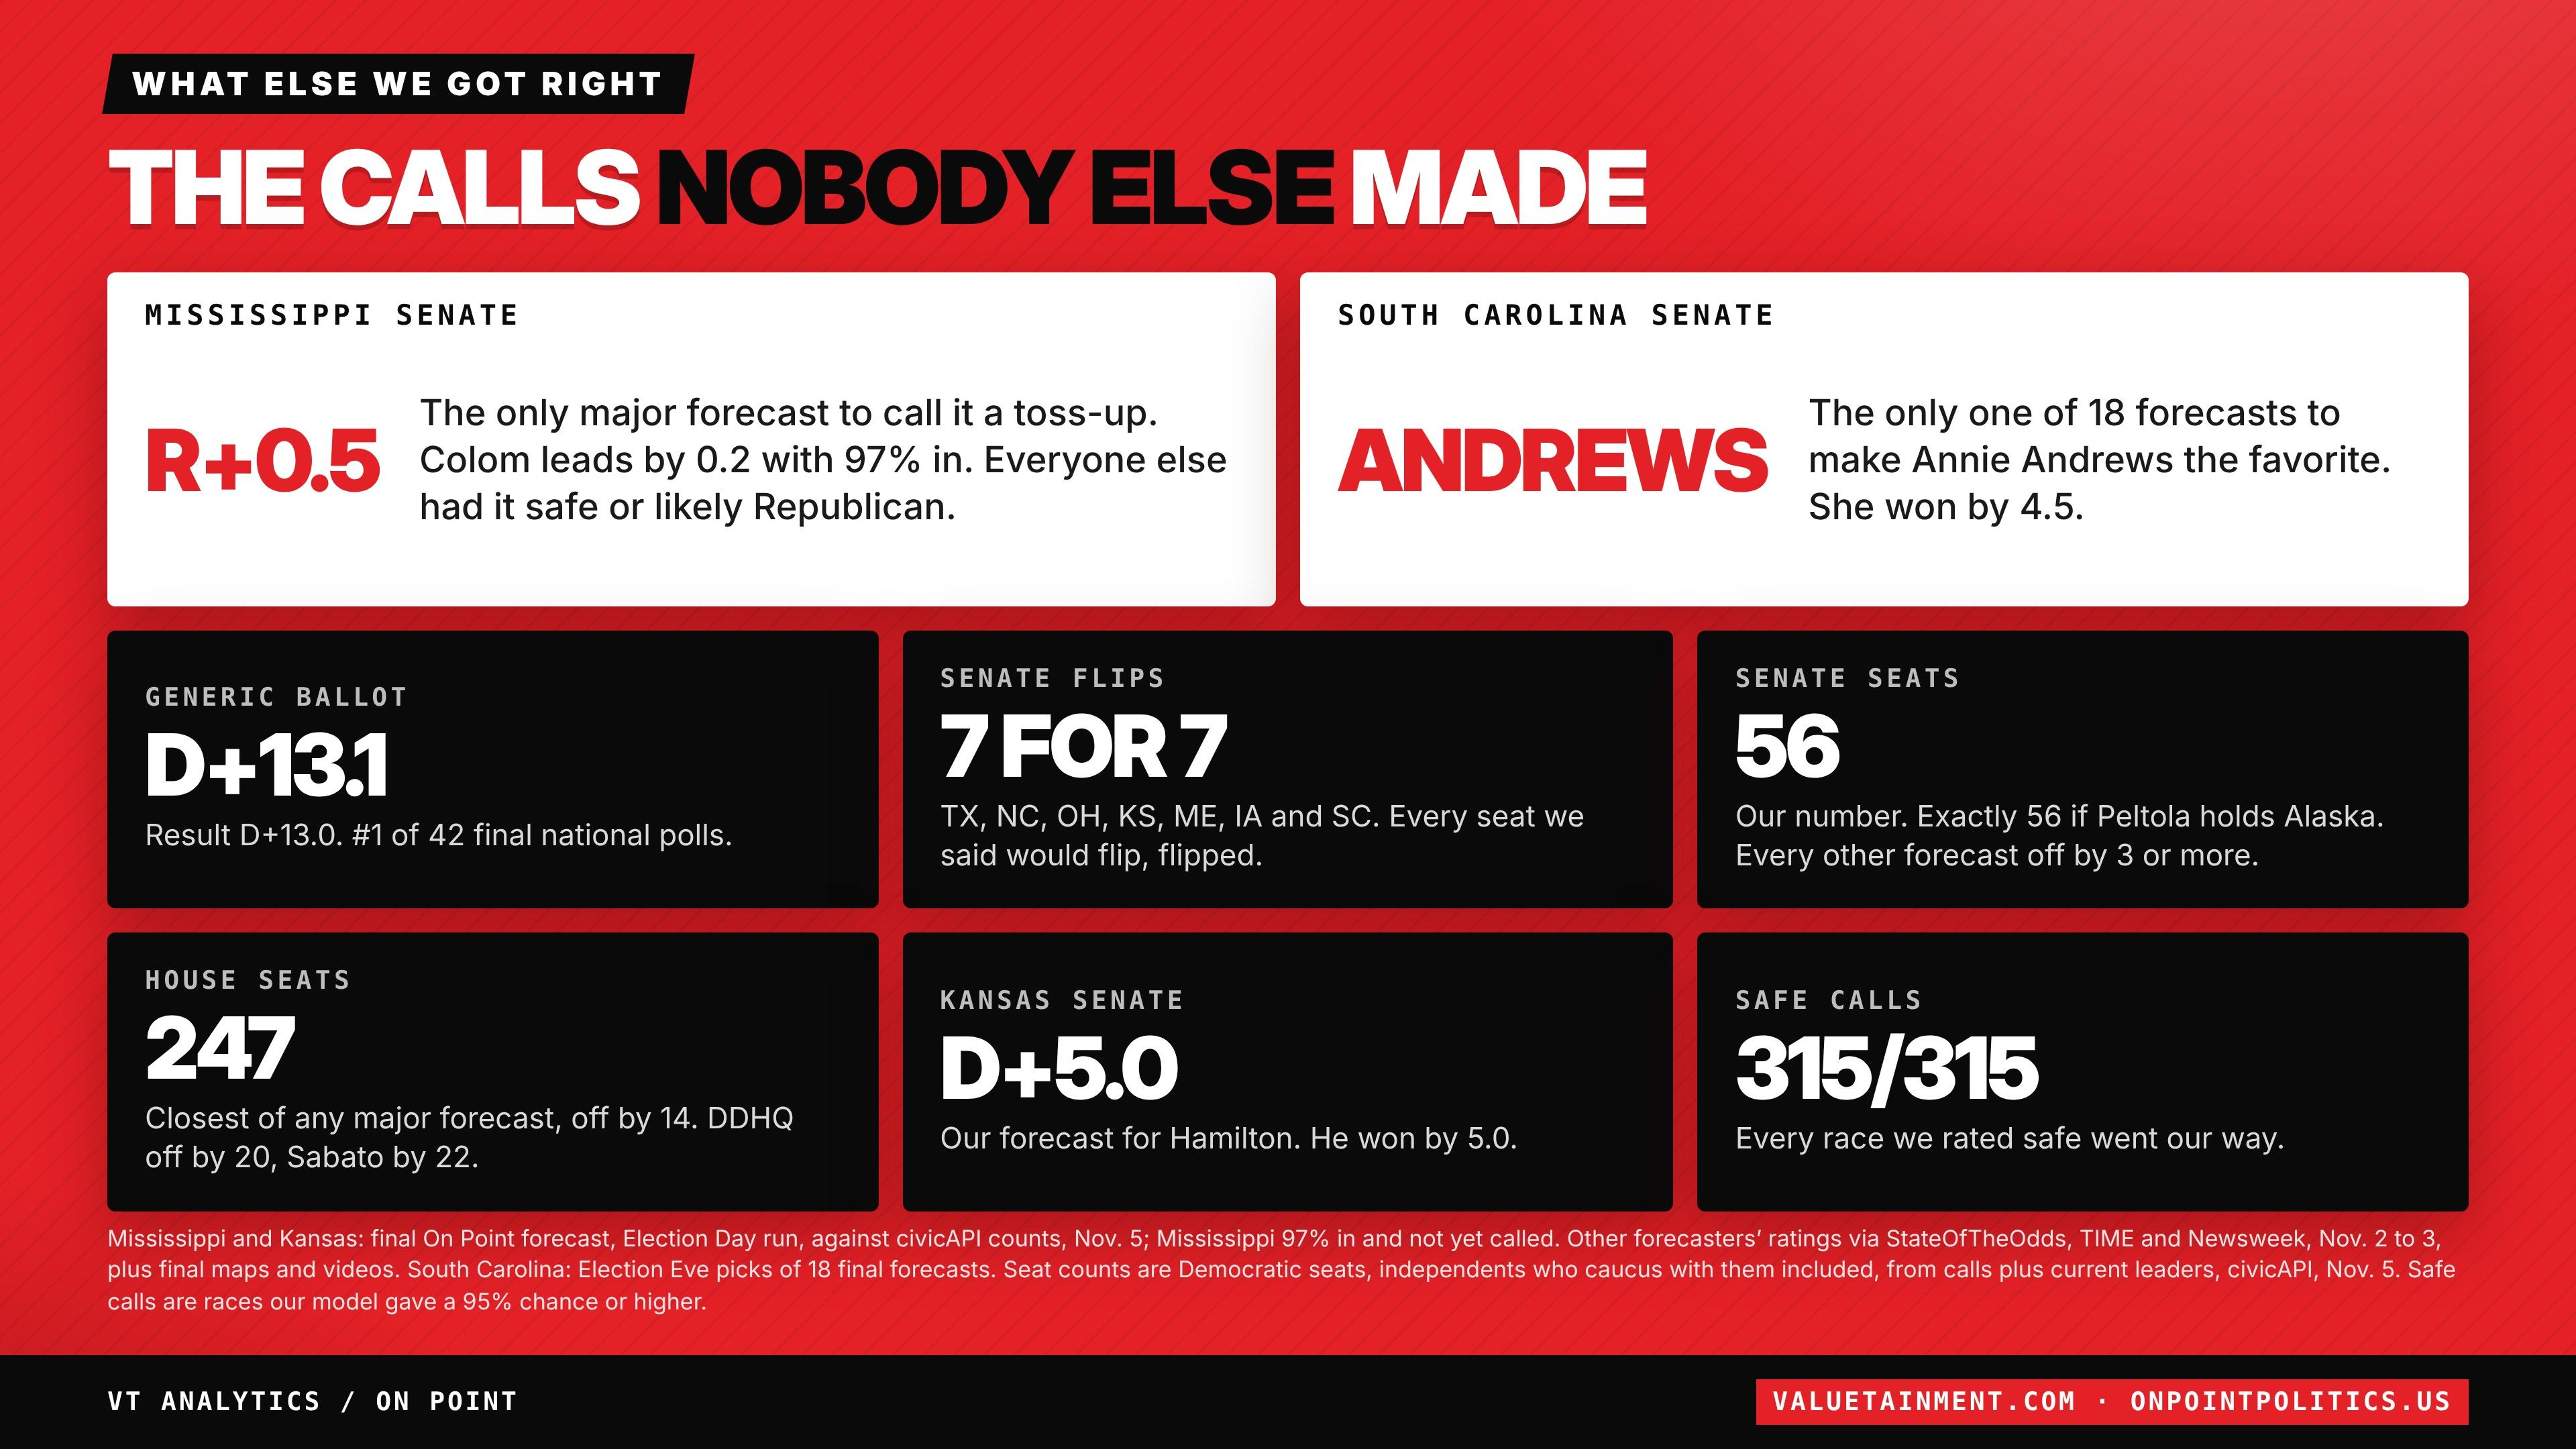
The calls nobody else made
Mississippi Senate
The only major forecast to call it a toss up. Colom leads by 0.2 with 97 percent counted; everyone else had it safe or likely Republican.
South Carolina Senate
The only one of 18 forecasts to make Annie Andrews the favorite. She won by 4.5.
Generic ballot
The result is D +13.0. Number one of 42 final national polls.
Senate flips
Texas, North Carolina, Ohio, Kansas, Maine, Iowa and South Carolina. Every seat we said would flip, flipped.
Senate seats
Our number. Exactly 56 if Peltola holds Alaska; every other forecast was off by 3 or more.
House seats
The closest of any major forecast, off by 14. The next closest were off by 20 and 22.
Kansas Senate
Our forecast for Hamilton. He won by 5.0.
Safe calls
Every race our model gave a 95 percent chance or higher went our way.
Mississippi and Kansas: the final On Point forecast against the count on the evening of November 5, with Mississippi 97 percent counted and not yet called. Other forecasters' ratings from their final pages, maps and videos, November 2 to 3. Seat counts are Democratic seats, independents who caucus with them included. Safe calls are races the model gave a 95 percent chance or higher.
Chamber control
Where the seats landed inside the forecast
The forecast's seat count is the called winner in every race plus the seats not up, the gold line. The white line is the count. Behind them is the seat distribution from 2,000 simulations, with its 80 percent range shaded.
Senate
Control called right- Forecast, called winners
- 55 D · 1 I · 44 R
- Count
- 55 D, 45 R, 2 still counting
- Seat miss
- R 1
- Count inside the 80% range
- Yes, 48 to 61 D
House
Control called right- Forecast, called winners
- 247 D · 188 R
- Count
- 262 D, 173 R, 65 still counting
- Seat miss
- D 15
- Count inside the 80% range
- Yes, 219 to 294 D
Governors
Control called right- Forecast, called winners
- 29 D · 21 R
- Count
- 30 D, 20 R, 3 still counting
- Seat miss
- D 1
- Count inside the 80% range
- Yes, 26 to 34 D
Scorecard
Every office, graded the same way
Miss is how far the result landed from the forecast margin. Lean is the average of those misses, the direction the whole map moved. A Brier score of 0 is perfect and 0.25 is a coin flip.
| Races | Called right | Average miss | Median miss | Lean of the miss | Inside 80% range | Average favorite chance | Favorites won | Brier |
|---|---|---|---|---|---|---|---|---|
| Senate | 32 of 35 | 4.0 | 3.1 | D 0.9 | 94% | 87% | 94% | 0.043 |
| Governor | 35 of 36 | 4.7 | 3.5 | D 0.4 | 88% | 90% | 97% | 0.026 |
| House | 409 of 435 | 5.4 | 4.3 | D 1.1 | 87% | 91% | 94% | 0.050 |
| All federal and governor | 476 of 506 | 5.3 | 4.1 | D 1.1 | 87% | 90% | 94% | 0.048 |
| Within 10 points | 108 of 133 | 3.9 | 2.7 | D 2.4 | 96% | 71% | 81% | 0.151 |
| Called races only | 413 of 420 | 5.3 | 4.2 | D 0.7 | 87% | 93% | 98% | 0.022 |
Called right counts every race, unopposed seats included. The other columns use the 479 races with both major parties on the count; the 10 races listed under method are left out of them.
How far each race landed
479 racesMiss by how close the forecast was
All offices| Forecast margin | Races | Called right | Average miss | Lean | Brier |
|---|---|---|---|---|---|
| 0 to 2 points | 31 | 58% | 3.3 | D 1.8 | 0.234 |
| 2 to 5 points | 35 | 91% | 3.5 | D 1.9 | 0.135 |
| 5 to 10 points | 67 | 87% | 4.3 | D 2.9 | 0.120 |
| 10 to 20 points | 100 | 97% | 5.4 | D 2.8 | 0.029 |
| 20 to 40 points | 147 | 100% | 5.9 | D 1.0 | 0.000 |
| 40 or more points | 99 | 100% | 6.1 | R 2.3 | 0.000 |
Calibration
Were the odds honest?
A forecast that gives favorites 80 percent should see them win about 80 percent of the time. Dots on the line are honest, dots above it mean the odds were too cautious, dots below mean they were too confident.
Forecast chance against how often favorites won
By bin
| Favorite chance | Federal races | Favorites won | Legislative races | Favorites won |
|---|---|---|---|---|
| 50 to 60% | 33 | 58% | 142 | 56% |
| 60 to 70% | 24 | 96% | 142 | 66% |
| 70 to 80% | 44 | 86% | 177 | 70% |
| 80 to 90% | 43 | 86% | 230 | 83% |
| 90 to 95% | 35 | 100% | 192 | 87% |
| 95 to 99% | 86 | 99% | 353 | 94% |
| 99 to 100% | 214 | 100% | 2,493 | 99% |
Federal favorites given 60 to 90 percent won 88 percent of 111 races against 77 percent expected, so those odds ran cautious. Legislative favorites given 70 to 99 percent won 85 percent against 89 percent, so those ran a little confident.
The map of the miss
Where the count ran ahead of the forecast
Hover a state or district for its forecast, its result and the miss.
Average miss in each state's Senate and governor races
Loading the map
Senate
32 of 35 Senate races called right
Sorted from the closest forecast to the safest. Average miss 4.0 points.
| State | Candidates | Forecast | Chance | 80% range | Result | Miss | Counted | Call |
|---|---|---|---|---|---|---|---|---|
| Mississippi | Scott Colom vs Cindy Hyde-Smith | R +0.5 | R 53% | D +11.2 to R +11.5 | Even | D 0.5 | 97% · counting | Missed |
| South Carolina | Annie Andrews vs Darline Graham | D +1.1 | D 53% | D +12.6 to R +10.2 | D +4.5 | D 3.4 | 100% | Right |
| Nebraska | Dan Osborn vs Pete Ricketts | I +2.0 | I 59% | I +12.6 to R +8.3 | R +6.5 | R 8.5 | 95% | Missed |
| Texas | James Talarico vs Ken Paxton | D +3.7 | D 70% | D +12.5 to R +5.3 | D +9.7 | D 6.0 | 97% | Right |
| Florida | Angie Nixon vs Ashley Moody | R +3.7 | R 68% | D +6.5 to R +13.9 | R +2.9 | D 0.8 | 93% | Right |
| Iowa | Josh Turek vs Ashley Hinson | D +3.7 | D 68% | D +13.8 to R +5.5 | D +4.2 | D 0.4 | 99% | Right |
| Kansas | Adam Hamilton vs Roger Marshall | D +5.0 | D 72% | D +15.9 to R +5.7 | D +5.0 | None | 96% | Right |
| Alaska | Mary Peltola vs Dan S. Sullivan | D +5.1 | D 75% | D +14.7 to R +4.5 | R +0.9 | 72% · counting | Not scored | |
| Maine | Troy Jackson vs Susan Collins | D +5.7 | D 78% | D +14.9 to R +4.0 | D +8.1 | D 2.4 | 83% | Right |
| Louisiana | Jamie Davis vs Julia Letlow | R +5.8 | R 74% | D +6.0 to R +16.9 | R +1.8 | D 4.0 | 100% | Right |
| Ohio | Sherrod Brown vs Jon Husted | D +6.7 | D 84% | D +14.9 to R +1.7 | D +4.2 | R 2.5 | 95% | Right |
| Michigan | Abdul El-Sayed vs Mike Rogers | D +8.8 | D 88% | D +18.3 to R +0.4 | D +6.6 | R 2.2 | 94% | Right |
| Arkansas | Hallie Shoffner vs Tom Cotton | R +9.2 | R 85% | D +1.6 to R +19.6 | R +11.8 | R 2.7 | 100% | Right |
| Kentucky | Charles Booker vs Andy Barr | R +10.6 | R 86% | D +1.9 to R +22.6 | R +12.1 | R 1.5 | 86% | Right |
| Minnesota | Peggy Flanagan vs Michele Tafoya | D +10.9 | D 92% | D +20.6 to D +1.4 | D +10.2 | R 0.8 | 100% | Right |
| North Carolina | Roy Cooper vs Michael Whatley | D +11.1 | D 94% | D +19.4 to D +2.6 | D +19.6 | D 8.5 | 100% | Right |
| Alabama | Everett Wess vs Barry Moore | R +12.6 | R 91% | R +1.1 to R +24.2 | R +9.4 | D 3.2 | 98% | Right |
| New Hampshire | Chris Pappas vs John E. Sununu | D +12.6 | D 91% | D +24.6 to D +1.0 | D +9.4 | R 3.2 | 59% | Right |
| Georgia | Jon Ossoff vs Mike Collins | D +12.8 | D 96% | D +21.0 to D +4.6 | D +18.0 | D 5.2 | 89% | Right |
| South Dakota | Brian Bengs vs Mike Rounds | R +12.8 | R 90% | I +0.2 to R +24.6 | R +21.3 | R 8.4 | 79% | Right |
| Montana | Seth Bodnar vs Kurt Alme | R +17.6 | R 97% | R +8.6 to R +26.5 | R +10.0 | I 7.6 | 74% | Right |
| Illinois | Juliana Stratton vs Don Tracy | D +17.8 | D 95% | D +30.1 to D +4.9 | D +27.6 | D 9.8 | 79% | Right |
| Oklahoma | N'Kiyla Jasmine Thomas vs Kevin Hern | R +18.4 | R 97% | R +8.1 to R +28.2 | R +18.1 | D 0.3 | 84% | Right |
| Idaho | Todd Achilles vs Jim Risch | R +18.7 | R 97% | R +8.8 to R +28.2 | R +23.3 | R 4.5 | 89% | Right |
| Tennessee | Marquita Bradshaw vs Bill Hagerty | R +18.9 | R 98% | R +8.5 to R +29.1 | R +12.2 | D 6.7 | 89% | Right |
| Virginia | Mark Warner vs Bert Mizusawa | D +20.8 | D 99% | D +31.0 to D +10.7 | D +22.2 | D 1.4 | 100% | Right |
| New Mexico | Ben Ray Luján vs Larry Marker | D +21.5 | D 98% | D +32.9 to D +9.9 | D +26.3 | D 4.8 | 88% | Right |
| Colorado | John Hickenlooper vs Mark Baisley | D +22.3 | D 97% | D +34.1 to D +9.9 | D +25.0 | D 2.7 | 76% | Right |
| New Jersey | Cory Booker vs Justin Murphy | D +26.2 | D 98% | D +39.5 to D +13.4 | D +27.2 | D 1.0 | 79% | Right |
| West Virginia | Rachel Fetty Anderson vs Shelley Moore Capito | R +27.7 | R 98% | R +14.7 to R +40.3 | R +20.4 | D 7.3 | 75% | Right |
| Delaware | Chris Coons vs Michael Katz | D +28.3 | D 98% | D +40.6 to D +15.8 | D +27.1 | R 1.1 | 100% | Right |
| Oregon | Jeff Merkley vs David Brock Smith | D +29.3 | D 99% | D +41.2 to D +17.3 | D +16.1 | R 13.3 | 74% | Right |
| Massachusetts | Ed Markey vs John Deaton | D +33.5 | D 99% | D +43.1 to D +23.6 | D +32.1 | R 1.4 | 76% | Right |
| Wyoming | James Byrd vs Harriet Hageman | R +38.4 | R 99% | R +27.9 to R +48.5 | R +30.5 | D 8.0 | 86% | Right |
| Rhode Island | Jack Reed vs Raymond McKay | D +40.2 | D 99% | D +50.5 to D +30.6 | D +37.2 | R 3.1 | 83% | Right |
Governors
35 of 36 governor races called right
Average miss 4.7 points.
| State | Candidates | Forecast | Chance | 80% range | Result | Miss | Counted | Call |
|---|---|---|---|---|---|---|---|---|
| Texas | Gina Hinojosa vs Greg Abbott | R +0.2 | R 52% | D +5.8 to R +6.0 | D +7.0 | D 7.3 | 96% | Missed |
| Florida | David Jolly vs Byron Donalds | R +1.6 | R 62% | D +6.5 to R +9.4 | R +1.3 | D 0.3 | 93% | Right |
| Nebraska | Lynne Walz vs Jim Pillen | R +3.6 | R 76% | D +3.0 to R +10.2 | R +8.2 | R 4.6 | 94% | Right |
| Kansas | Cindy Holscher vs Ty Masterson | D +3.8 | D 72% | D +12.0 to R +4.6 | D +0.5 | R 3.3 | 95% · counting | Right |
| Georgia | Keisha Lance Bottoms vs Rick Jackson | D +3.9 | D 77% | D +10.5 to R +3.0 | D +8.6 | D 4.8 | 89% | Right |
| Oregon | Tina Kotek vs Christine Drazan | D +4.3 | D 77% | D +12.0 to R +3.6 | D +6.3 | D 1.9 | 75% | Right |
| New Hampshire | Cinde Warmington vs Kelly Ayotte | R +4.8 | R 78% | D +3.1 to R +12.9 | R +9.1 | R 4.3 | 59% · counting | Right |
| Vermont | Amanda Janoo vs Phil Scott | R +5.1 | R 80% | D +3.2 to R +13.2 | R +6.6 | R 1.4 | 100% | Right |
| Ohio | Amy Acton vs Vivek Ramaswamy | D +5.7 | D 86% | D +12.5 to R +0.9 | D +7.2 | D 1.6 | 95% | Right |
| Oklahoma | Cyndi Munson vs Mike Mazzei | R +5.8 | R 79% | D +3.7 to R +14.9 | R +6.1 | R 0.3 | 84% | Right |
| Nevada | Aaron Ford vs Joe Lombardo | D +6.1 | D 85% | D +13.7 to R +1.4 | D +7.2 | D 1.1 | 77% | Right |
| Wisconsin | David Crowley vs Tom Tiffany | D +6.5 | D 85% | D +14.9 to R +1.6 | D +8.4 | D 1.9 | 89% | Right |
| South Carolina | Jermaine Johnson vs Alan Wilson | R +7.2 | R 85% | D +1.7 to R +15.6 | R +4.5 | D 2.7 | 100% | Right |
| Iowa | Rob Sand vs Zach Lahn | D +7.9 | D 93% | D +15.0 to D +0.8 | D +11.1 | D 3.2 | 100% | Right |
| Alaska | Jonathan Kreiss-Tomkins vs Bernadette Wilson | D +8.1 | D 95% | D +14.3 to D +2.0 | D +19.4 | 71% · counting | Not scored | |
| Tennessee | Jerri Green vs Marsha Blackburn | R +9.1 | R 93% | R +1.4 to R +16.6 | R +2.5 | D 6.6 | 91% | Right |
| Arizona | Katie Hobbs vs Andy Biggs | D +9.5 | D 96% | D +16.9 to D +2.3 | D +14.6 | D 5.0 | 60% | Right |
| Alabama | Doug Jones vs Tommy Tuberville | R +10.8 | R 96% | R +2.9 to R +18.4 | R +4.1 | D 6.7 | 98% | Right |
| New Mexico | Deb Haaland vs Gregg Hull | D +11.6 | D 98% | D +18.9 to D +4.3 | D +14.5 | D 2.9 | 89% | Right |
| Maine | Hannah Pingree vs Bobby Charles | D +12.5 | D 98% | D +19.9 to D +4.8 | D +18.7 | D 6.2 | 84% | Right |
| Arkansas | Fredrick Love vs Sarah Huckabee Sanders | R +13.9 | R 98% | R +5.8 to R +22.0 | R +15.3 | R 1.4 | 100% | Right |
| Rhode Island | Helena Foulkes vs Aaron Guckian | D +14.1 | D 99% | D +20.7 to D +7.3 | D +44.3 | 83% | Not scored | |
| South Dakota | Dan Ahlers vs Larry Rhoden | R +14.7 | R 96% | R +5.1 to R +23.7 | R +27.0 | R 12.3 | 79% | Right |
| Michigan | Jocelyn Benson vs John James | D +14.7 | D 99% | D +21.4 to D +8.1 | D +10.3 | R 4.4 | 94% | Right |
| Minnesota | Amy Klobuchar vs Lisa Demuth | D +14.8 | D 99% | D +21.7 to D +7.6 | D +12.8 | R 1.9 | 100% | Right |
| New York | Kathy Hochul vs Bruce Blakeman | D +16.0 | D 100% | D +22.6 to D +9.3 | D +19.8 | D 3.7 | 99% | Right |
| Connecticut | Ned Lamont vs Ryan Fazio | D +19.0 | D 100% | D +26.5 to D +11.4 | D +16.7 | R 2.3 | 80% | Right |
| Idaho | Terri Pickens vs Brad Little | R +19.5 | R 100% | R +12.4 to R +26.5 | R +25.2 | R 5.8 | 90% | Right |
| Colorado | Phil Weiser vs Victor Marx | D +20.2 | D 100% | D +29.0 to D +11.0 | D +27.6 | D 7.4 | 76% | Right |
| Illinois | JB Pritzker vs Darren Bailey | D +24.9 | D 100% | D +32.4 to D +17.6 | D +27.5 | D 2.6 | 77% | Right |
| Massachusetts | Maura Healey vs Michael Minogue | D +25.1 | D 100% | D +32.5 to D +17.6 | D +28.9 | D 3.7 | 76% | Right |
| Pennsylvania | Josh Shapiro vs Stacy Garrity | D +25.6 | D 100% | D +32.1 to D +19.4 | D +21.5 | R 4.1 | 81% | Right |
| California | Xavier Becerra vs Steve Hilton | D +26.1 | D 100% | D +32.9 to D +19.6 | D +28.0 | D 1.9 | 56% | Right |
| Wyoming | Kenneth Casner vs Eric Barlow | R +29.6 | R 100% | R +20.8 to R +37.9 | R +53.9 | R 24.4 | 86% | Right |
| Maryland | Wes Moore vs Dan Cox | D +31.9 | D 100% | D +37.8 to D +25.5 | D +29.4 | R 2.5 | 74% | Right |
| Hawaii | Josh Green vs Gary Cordery | D +35.1 | D 100% | D +44.4 to D +25.8 | D +49.9 | D 14.7 | 66% | Right |
House
409 of 435 House races called right
262 Democratic seats on the count against 247 called by the forecast. Within 10 points the forecast called 83 of 105, and the lean of the miss there was D 2.8.
| District | Candidates | Forecast | Chance | 80% range | Result | Miss | Counted | Call |
|---|---|---|---|---|---|---|---|---|
| VA 1 | Shannon Taylor vs Rob Wittman | R +0.1 | R 51% | D +9.6 to R +9.7 | D +1.2 | D 1.3 | 100% · counting | Missed |
| FL 9 | Darren Soto vs Dan Green | R +0.3 | R 52% | D +13.2 to R +13.4 | D +0.5 | D 0.8 | 87% · counting | Missed |
| CO 3 | Dwayne Romero vs Jeff Hurd | R +0.5 | R 52% | D +10.6 to R +11.7 | D +0.4 | D 0.9 | 80% · counting | Missed |
| AZ 2 | Jonathan Nez vs Eli Crane | R +0.5 | R 53% | D +10.1 to R +11.4 | D +0.7 | D 1.1 | 78% · counting | Missed |
| OK 5 | Jena Nelson vs Stephanie Bice | D +0.5 | D 52% | D +13.4 to R +12.1 | R +1.3 | R 1.8 | 100% · counting | Missed |
| CO 5 | Jessica Killin vs Jeff Crank | R +0.6 | R 54% | D +9.3 to R +10.5 | D +6.3 | D 6.9 | 66% · counting | Missed |
| TX 23 | Katy Padilla Stout vs Brandon Herrera | R +0.7 | R 52% | D +11.1 to R +12.5 | D +8.0 | D 8.7 | 99% | Missed |
| OH 15 | Don Leonard vs Mike Carey | R +0.8 | R 54% | D +10.9 to R +12.2 | D +6.6 | D 7.4 | 100% | Missed |
| TN 9 | Justin Pearson vs Brent Taylor | D +1.3 | D 55% | D +13.5 to R +10.8 | R +1.1 | R 2.5 | 88% · counting | Missed |
| TX 24 | Kevin Burge vs Beth Van Duyne | D +1.4 | D 56% | D +13.4 to R +10.4 | R +6.8 | R 8.2 | 99% | Missed |
| OH 10 | Kristina Knickerbocker vs Mike Turner | R +1.8 | R 58% | D +10.0 to R +13.7 | D +1.6 | D 3.5 | 100% · counting | Missed |
| TX 9 | Leticia Gutierrez vs Alex Mealer | R +4.1 | R 69% | D +6.8 to R +15.2 | D +14.0 | D 18.1 | 54% · counting | Missed |
| CO 4 | Eileen Laubacher vs Lauren Boebert | R +4.2 | R 72% | D +5.5 to R +14.1 | D +1.4 | D 5.7 | 97% · counting | Missed |
| IN 5 | J.D. Ford vs Victoria Spartz | R +5.2 | R 71% | D +6.6 to R +16.7 | D +3.3 | D 8.6 | 99% | Missed |
| NC 13 | Paul Barringer vs Brad Knott | R +5.6 | R 72% | D +6.6 to R +17.3 | D +2.4 | D 8.1 | 99% · counting | Missed |
| OK 1 | John Croisant vs Mark Tedford | D +6.5 | D 73% | D +20.7 to R +7.1 | R +4.6 | R 11.2 | 100% | Missed |
| NE 1 | Chris Backemeyer vs Mike Flood | D +7.3 | D 79% | D +18.7 to R +4.5 | R +3.4 | R 10.6 | 95% · counting | Missed |
| NJ 2 | Zack Mullock vs Jeff Van Drew | R +7.3 | R 80% | D +3.8 to R +18.1 | D +3.2 | D 10.5 | 80% · counting | Missed |
| FL 26 | Nicole Locklin vs Mario Diaz-Balart | R +8.1 | R 81% | D +4.0 to R +20.2 | D +0.5 | D 8.5 | 71% · counting | Missed |
| NC 9 | Richard Ojeda vs Richard Hudson | R +8.1 | R 82% | D +3.2 to R +19.3 | D +2.2 | D 10.3 | 100% · counting | Missed |
| TN 4 | Victoria Broderick vs Scott DesJarlais | R +9.3 | R 81% | D +4.4 to R +22.2 | D +0.1 | D 9.4 | 76% · counting | Missed |
| AZ 5 | Elizabeth Lee vs Mark Lamb | R +9.8 | R 85% | D +2.8 to R +21.9 | D +0.8 | D 10.6 | 69% · counting | Missed |
| NC 6 | Cyril Jefferson vs Addison McDowell | R +11.5 | R 88% | D +1.4 to R +24.0 | D +2.3 | D 13.8 | 100% · counting | Missed |
| NC 14 | LaKesha Womack vs Tim Moore | R +11.5 | R 89% | D +0.2 to R +23.2 | D +2.2 | D 13.8 | 100% · counting | Missed |
| NC 5 | Chuck Hubbard vs Virginia Foxx | R +14.2 | R 95% | R +3.1 to R +24.9 | Even | D 14.3 | 100% · counting | Missed |
Counties
3,192 counties in 64 statewide races
Counties at 95 percent counted or more. The county miss splits in two: the statewide miss every county shares, and the shape miss left after it is taken out, which is the county model on its own.
By kind of place and region
| Counties | Count | Votes | Miss | Shape miss | Lean |
|---|---|---|---|---|---|
| City | 80 | 27.8M | 4.3 | 3.7 | D 0.4 |
| Rural | 2,525 | 24.4M | 5.5 | 4.5 | D 0.1 |
| Suburban | 587 | 53.0M | 5.1 | 3.5 | D 2.5 |
| Southwest | 165 | 13.4M | 8.3 | 6.0 | D 5.0 |
| Southeast Atlantic | 720 | 30.2M | 4.6 | 3.5 | D 3.2 |
| Appalachia / South Interior | 423 | 7.7M | 5.3 | 4.5 | D 0.9 |
| West / Mountain / Pacific | 226 | 8.9M | 4.6 | 3.0 | D 0.7 |
| Mid-Atlantic | 146 | 9.8M | 5.0 | 3.6 | D 0.3 |
| Great Lakes | 613 | 24.5M | 3.9 | 3.3 | R 0.6 |
| New England | 31 | 1.5M | 3.5 | 1.5 | R 0.7 |
| Lower Midwest / Plains | 868 | 9.1M | 5.0 | 3.5 | R 2.3 |
The biggest misses in large counties
20,000 votes or more| County | Race | Forecast | Result | Miss |
|---|---|---|---|---|
| Liberty, TX | Senate | R +54.8 | R +28.1 | D 26.7 |
| Liberty, TX | Governor | R +56.6 | R +30.4 | D 26.2 |
| Kaufman, TX | Senate | R +21.0 | D +1.3 | D 22.3 |
| Johnston, NC | Senate | R +16.2 | D +6.0 | D 22.3 |
| Dallas, TX | Senate | D +41.6 | D +20.0 | R 21.5 |
| Hidalgo, TX | Senate | D +24.9 | D +46.5 | D 21.5 |
| Whitfield, GA | Governor | R +43.7 | R +23.3 | D 20.3 |
| Whitfield, GA | Senate | R +33.5 | R +13.2 | D 20.2 |
| Natrona, WY | Governor | R +33.0 | R +53.1 | R 20.1 |
| Kaufman, TX | Governor | R +22.6 | R +2.5 | D 20.1 |
| Cameron, TX | Governor | D +14.7 | D +34.6 | D 19.9 |
| Hidalgo, TX | Governor | D +22.7 | D +42.0 | D 19.3 |
| Itasca, MN | Governor | D +5.7 | R +13.3 | R 18.9 |
| Ellis, TX | Senate | R +22.8 | R +4.5 | D 18.3 |
| McLean, IL | Senate | R +2.6 | D +15.2 | D 17.9 |
County accuracy in every statewide race
| Race | Counties | Miss | Shape miss | Lean | Within 5 |
|---|---|---|---|---|---|
| New Mexico Senate | 2 | 2.0 | 2.0 | None | 100% |
| New Mexico Governor | 2 | 2.2 | 2.4 | R 0.4 | 100% |
| Maine Senate | 2 | 2.5 | 1.5 | D 2.5 | 100% |
| Vermont Governor | 14 | 2.6 | 2.1 | R 1.7 | 100% |
| Wisconsin Governor | 3 | 2.7 | 2.7 | D 0.7 | 100% |
| Minnesota Senate | 84 | 2.7 | 2.6 | R 1.0 | 54% |
| Massachusetts Governor | 3 | 2.7 | 1.8 | D 2.4 | 67% |
| Florida Senate | 59 | 2.8 | 2.5 | D 1.1 | 83% |
| Ohio Governor | 86 | 2.9 | 2.7 | D 2.2 | 67% |
| Iowa Senate | 99 | 3.0 | 3.0 | R 0.2 | 78% |
| Oklahoma Senate | 75 | 3.1 | 2.9 | R 0.6 | 56% |
| Minnesota Governor | 84 | 3.1 | 3.8 | R 2.4 | 35% |
| Virginia Senate | 95 | 3.1 | 2.5 | D 2.4 | 71% |
| Florida Governor | 58 | 3.3 | 2.8 | D 1.6 | 71% |
| Rhode Island Senate | 3 | 3.3 | 0.2 | R 3.3 | 100% |
| Oklahoma Governor | 75 | 3.4 | 2.8 | R 1.4 | 55% |
| Colorado Senate | 30 | 3.4 | 1.4 | D 2.9 | 80% |
| Ohio Senate special | 87 | 3.5 | 3.2 | R 1.7 | 70% |
| California Governor | 50 | 3.5 | 2.9 | D 1.4 | 50% |
| Massachusetts Senate | 3 | 3.5 | 2.6 | R 1.4 | 67% |
| Michigan Senate | 69 | 3.7 | 3.2 | R 2.0 | 75% |
| Arizona Governor | 9 | 3.8 | 2.1 | D 3.8 | 67% |
| Connecticut Governor | 3 | 3.8 | 1.1 | R 3.3 | 67% |
| Pennsylvania Governor | 63 | 4.1 | 1.9 | R 4.0 | 54% |
| Illinois Governor | 64 | 4.1 | 4.3 | R 1.5 | 28% |
| Iowa Governor | 99 | 4.1 | 3.4 | D 2.5 | 47% |
| Alabama Governor | 29 | 4.3 | 3.8 | D 2.5 | 55% |
| Alabama Senate | 24 | 4.3 | 4.0 | D 1.0 | 33% |
| Delaware Senate | 3 | 4.3 | 4.3 | R 0.1 | 67% |
| Kentucky Senate | 8 | 4.4 | 2.6 | R 3.1 | 75% |
| Michigan Governor | 70 | 4.4 | 2.7 | R 4.2 | 53% |
| New Jersey Senate | 5 | 4.4 | 3.9 | D 3.4 | 60% |
| Louisiana Senate | 64 | 4.7 | 4.0 | D 3.1 | 59% |
| Maryland Governor | 22 | 4.9 | 4.8 | R 0.9 | 64% |
| Georgia Senate | 158 | 4.9 | 4.0 | D 4.2 | 53% |
| South Carolina Governor | 46 | 5.2 | 4.4 | D 2.5 | 50% |
| Kansas Governor | 104 | 5.2 | 4.1 | R 4.4 | 25% |
| Georgia Governor | 158 | 5.3 | 4.6 | D 3.6 | 64% |
| South Carolina Senate | 46 | 5.3 | 4.2 | D 3.2 | 48% |
| Arkansas Senate | 75 | 5.3 | 3.7 | R 4.0 | 35% |
| Arkansas Governor | 75 | 5.5 | 5.0 | R 2.8 | 55% |
| Maine Governor | 3 | 5.5 | 2.9 | D 5.5 | 67% |
| Kansas Senate | 104 | 5.7 | 5.3 | R 1.4 | 58% |
| Mississippi Senate | 81 | 5.9 | 5.9 | R 0.3 | 51% |
| New York Governor | 53 | 6.0 | 4.4 | D 3.8 | 64% |
| Idaho Senate | 38 | 6.4 | 4.1 | R 5.5 | 55% |
| Tennessee Governor | 10 | 6.4 | 6.1 | D 1.6 | 10% |
| West Virginia Senate | 52 | 6.5 | 2.9 | D 6.4 | 48% |
| Texas Governor | 76 | 6.5 | 4.3 | D 6.1 | 33% |
| Nebraska Governor | 91 | 6.7 | 4.0 | R 4.8 | 52% |
| Colorado Governor | 30 | 7.1 | 2.2 | D 7.1 | 30% |
| Tennessee Senate | 5 | 7.2 | 4.0 | D 7.2 | 20% |
| Wyoming Senate | 13 | 7.8 | 5.0 | D 7.3 | 46% |
| South Dakota Senate | 65 | 8.0 | 4.7 | R 7.9 | 19% |
| North Carolina Senate | 100 | 8.0 | 3.8 | D 7.5 | 32% |
| Oregon Governor | 7 | 8.1 | 0.9 | D 8.1 | 0% |
| Idaho Governor | 38 | 8.2 | 5.2 | R 6.7 | 26% |
| Nebraska Senate | 91 | 8.9 | 2.5 | R 8.7 | 24% |
| Illinois Senate | 66 | 9.8 | 5.5 | D 8.7 | 56% |
| Texas Senate | 76 | 10.1 | 7.8 | D 4.0 | 29% |
| Oregon Senate | 6 | 10.9 | 1.3 | R 10.9 | 33% |
| South Dakota Governor | 65 | 12.2 | 3.4 | R 11.8 | 5% |
| Montana Senate | 2 | 12.9 | 1.6 | D 12.9 | 0% |
| Wyoming Governor | 12 | 14.4 | 5.8 | R 14.2 | 8% |
State legislatures
80 of 83 settled chambers called right
5,331 of 5,641 legislative seats with a result went to the forecast's favorite, 1,687 of them uncontested. Among 3,729 districts with both parties on the ballot the forecast called 92.5 percent, with an average miss of 7.1 points.
Lean of the miss by forecast lean
Contested districtsChambers the forecast missed or could not settle
| Chamber | Forecast | Called seats | Count | Status |
|---|---|---|---|---|
| Florida House | R 92% | 48 D · 71 R | 50 D · 69 R | 1 seat unread |
| Georgia House | R 39% | 88 D · 92 R | 92 D · 87 R | Missed |
| Hawaii Senate | D 100% | 20 D · 2 R | 19 D · 3 R | 3 seats unread |
| Oklahoma House | R 100% | 17 D · 38 R | 14 D · 41 R | 46 seats unread |
| Oklahoma Senate | R 100% | 1 D · 37 R | 1 D · 37 R | 10 seats unread |
| Pennsylvania Senate | R 88% | 22 D · 28 R | 26 D · 24 R | Missed |
| Texas House | R 72% | 68 D · 82 R | 83 D · 67 R | Missed |
All 87 chambers
| Chamber | Seats up | Forecast control | Called seats | 80% range | Count | Seat miss | Districts right | Control |
|---|---|---|---|---|---|---|---|---|
| Alaska House | 40 of 40 | D 92% | 21 D · 19 R | 17 to 18 D | 21 D · 17 R · 2 | None | 26 of 29 | Right |
| Alaska Senate | 10 of 20 | R 100% | 9 D · 11 R | 9 to 9 D | 8 D · 11 R · 1 | R 1 | 3 of 3 | Right |
| Alabama House | 105 of 105 | R 100% | 30 D · 75 R | 29 to 32 D | 31 D · 74 R | D 1 | 33 of 34 | Right |
| Alabama Senate | 35 of 35 | R 100% | 9 D · 26 R | 8 to 10 D | 11 D · 24 R | D 2 | 14 of 16 | Right |
| Arkansas House | 100 of 100 | R 100% | 25 D · 75 R | 23 to 29 D | 30 D · 70 R | D 5 | 26 of 31 | Right |
| Arkansas Senate | 17 of 35 | R 100% | 8 D · 27 R | 7 to 8 D | 7 D · 28 R | R 1 | 3 of 4 | Right |
| Arizona House | 60 of 60 | D 58% | 32 D · 28 R | 28 to 33 D | 32 D · 28 R | None | 25 of 25 | Right |
| Arizona Senate | 30 of 30 | D 93% | 19 D · 11 R | 16 to 20 D | 20 D · 10 R | D 1 | 24 of 25 | Right |
| California Assembly | 80 of 80 | D 100% | 67 D · 13 R | 65 to 70 D | 64 D · 16 R | R 3 | 59 of 62 | Right |
| California Senate | 20 of 40 | D 100% | 32 D · 8 R | 31 to 34 D | 32 D · 8 R | None | 15 of 17 | Right |
| Colorado House | 65 of 65 | D 100% | 47 D · 18 R | 46 to 51 D | 49 D · 16 R | D 2 | 48 of 50 | Right |
| Colorado Senate | 21 of 35 | D 100% | 24 D · 11 R | 22 to 24 D | 24 D · 11 R | None | 17 of 17 | Right |
| Connecticut House | 151 of 151 | D 100% | 133 D · 18 R | 123 to 138 D | 116 D · 35 R | R 17 | 94 of 109 | Right |
| Connecticut Senate | 36 of 36 | D 100% | 36 D · 0 R | 32 to 36 D | 33 D · 3 R | R 3 | 26 of 29 | Right |
| Delaware House | 41 of 41 | D 100% | 32 D · 9 R | 30 to 33 D | 30 D · 11 R | R 2 | 21 of 23 | Right |
| Delaware Senate | 11 of 21 | D 100% | 15 D · 6 R | 15 to 15 D | 15 D · 6 R | None | 5 of 5 | Right |
| Florida House | 120 of 120 | R 92% | 48 D · 71 R | 42 to 59 D | 50 D · 69 R | 84 of 90 | Not settled | |
| Florida Senate | 20 of 40 | R 100% | 15 D · 25 R | 12 to 16 D | 13 D · 27 R | R 2 | 15 of 17 | Right |
| Georgia House | 180 of 180 | R 39% | 88 D · 92 R | 86 to 97 D | 92 D · 87 R | D 4 | 108 of 119 | Missed |
| Georgia Senate | 56 of 56 | R 82% | 24 D · 32 R | 24 to 28 D | 27 D · 29 R | D 3 | 32 of 35 | Right |
| Hawaii House | 51 of 51 | D 100% | 48 D · 3 R | 46 to 48 D | 44 D · 6 R · 1 | R 4 | 23 of 26 | Right |
| Hawaii Senate | 17 of 25 | D 100% | 20 D · 2 R | 23 to 23 D | 19 D · 3 R | 2 of 2 | Not settled | |
| Iowa House | 100 of 100 | R 92% | 42 D · 58 R | 37 to 49 D | 44 D · 56 R | D 2 | 67 of 69 | Right |
| Iowa Senate | 25 of 50 | R 100% | 19 D · 31 R | 17 to 20 D | 18 D · 32 R | R 1 | 18 of 19 | Right |
| Idaho House | 70 of 70 | R 100% | 12 D · 58 R | 10 to 14 D | 14 D · 56 R | D 2 | 54 of 56 | Right |
| Idaho Senate | 35 of 35 | R 100% | 6 D · 29 R | 5 to 8 D | 7 D · 28 R | D 1 | 31 of 32 | Right |
| Illinois House | 118 of 118 | D 100% | 88 D · 30 R | 85 to 93 D | 84 D · 34 R | R 4 | 52 of 53 | Right |
| Illinois Senate | 39 of 59 | D 100% | 47 D · 12 R | 44 to 47 D | 45 D · 14 R | R 2 | 20 of 22 | Right |
| Indiana House | 100 of 100 | R 100% | 35 D · 65 R | 32 to 41 D | 46 D · 54 R | D 11 | 65 of 76 | Right |
| Indiana Senate | 25 of 50 | R 100% | 12 D · 38 R | 11 to 14 D | 15 D · 35 R | D 3 | 17 of 18 | Right |
| Kansas House | 125 of 125 | R 93% | 57 D · 68 R | 50 to 62 D | 57 D · 68 R | None | 77 of 84 | Right |
| Kentucky House | 100 of 100 | R 100% | 25 D · 75 R | 22 to 28 D | 21 D · 72 R | R 4 | Right | |
| Kentucky Senate | 19 of 38 | R 100% | 7 D · 31 R | 6 to 8 D | 7 D · 30 R | None | Right | |
| Massachusetts House | 160 of 160 | D 100% | 146 D · 14 R | 140 to 147 D | 138 D · 21 R · 1 | R 8 | 29 of 39 | Right |
| Massachusetts Senate | 40 of 40 | D 100% | 36 D · 4 R | 34 to 36 D | 35 D · 5 R | R 1 | 6 of 7 | Right |
| Maryland House of Delegates | 141 of 141 | D 100% | 104 D · 37 R | 104 to 111 D | 104 D · 37 R | None | 48 of 48 | Right |
| Maryland Senate | 47 of 47 | D 100% | 36 D · 11 R | 34 to 39 D | 34 D · 13 R | R 2 | 25 of 27 | Right |
| Maine House | 151 of 151 | D 99% | 88 D · 63 R | 81 to 99 D | 91 D · 60 R | D 3 | 100 of 111 | Right |
| Maine Senate | 35 of 35 | D 100% | 23 D · 12 R | 21 to 25 D | 24 D · 11 R | D 1 | 25 of 26 | Right |
| Michigan House | 110 of 110 | D 94% | 62 D · 48 R | 57 to 68 D | 58 D · 47 R | R 4 | 75 of 77 | Right |
| Michigan Senate | 38 of 38 | D 95% | 22 D · 16 R | 20 to 23 D | 21 D · 15 R | R 1 | 32 of 32 | Right |
| Minnesota House | 134 of 134 | D 100% | 82 D · 52 R | 77 to 87 D | 77 D · 57 R | R 5 | 112 of 117 | Right |
| Minnesota Senate | 67 of 67 | D 99% | 42 D · 25 R | 37 to 44 D | 39 D · 28 R | R 3 | 60 of 63 | Right |
| Missouri House | 163 of 163 | R 100% | 65 D · 98 R | 60 to 70 D | 68 D · 95 R | D 3 | 124 of 129 | Right |
| Missouri Senate | 17 of 34 | R 100% | 12 D · 22 R | 10 to 13 D | 12 D · 22 R | None | 16 of 16 | Right |
| Montana House | 100 of 100 | R 100% | 44 D · 56 R | 41 to 46 D | 44 D · 56 R | None | 85 of 85 | Right |
| Montana Senate | 25 of 50 | R 100% | 20 D · 30 R | 19 to 22 D | 20 D · 30 R | None | 21 of 21 | Right |
| North Carolina House | 120 of 120 | D 58% | 60 D · 60 R | 56 to 68 D | 72 D · 48 R | D 12 | 73 of 85 | Right |
| North Carolina Senate | 50 of 50 | R 68% | 24 D · 26 R | 21 to 26 D | 24 D · 26 R | None | 44 of 44 | Right |
| North Dakota House | 50 of 94 | R 100% | 13 D · 81 R | 11 to 17 D | 14 D · 79 R | D 1 | 19 of 20 | Right |
| North Dakota Senate | 24 of 47 | R 100% | 8 D · 39 R | 6 to 10 D | 6 D · 41 R | R 2 | 13 of 15 | Right |
| New Hampshire House | 400 of 400 | D 99% | 263 D · 137 R | 227 to 285 D | 294 D · 106 R | D 31 | 138 of 162 | Right |
| New Hampshire Senate | 24 of 24 | D 91% | 17 D · 7 R | 13 to 20 D | 15 D · 9 R | R 2 | 21 of 23 | Right |
| New Mexico House | 70 of 70 | D 100% | 47 D · 23 R | 44 to 49 D | 47 D · 23 R | None | 26 of 28 | Right |
| Nevada Assembly | 42 of 42 | D 100% | 32 D · 10 R | 29 to 34 D | 32 D · 10 R | None | 27 of 27 | Right |
| Nevada Senate | 11 of 21 | D 100% | 13 D · 8 R | 13 to 14 D | 13 D · 8 R | None | 8 of 8 | Right |
| New York Assembly | 150 of 150 | D 100% | 112 D · 38 R | 107 to 118 D | 111 D · 39 R | R 1 | 90 of 97 | Right |
| New York Senate | 63 of 63 | D 100% | 51 D · 12 R | 47 to 53 D | 47 D · 16 R | R 4 | 37 of 45 | Right |
| Ohio House | 99 of 99 | R 97% | 42 D · 57 R | 39 to 47 D | 43 D · 56 R | D 1 | 84 of 85 | Right |
| Ohio Senate | 17 of 33 | R 100% | 12 D · 21 R | 11 to 14 D | 11 D · 22 R | R 1 | 15 of 16 | Right |
| Oklahoma House | 101 of 101 | R 100% | 17 D · 38 R | 25 to 35 D | 14 D · 41 R | 39 of 44 | Not settled | |
| Oklahoma Senate | 24 of 48 | R 100% | 1 D · 37 R | 1 to 2 D | 1 D · 37 R | 5 of 5 | Not settled | |
| Oregon House | 60 of 60 | D 100% | 39 D · 21 R | 38 to 41 D | 39 D · 21 R | None | 46 of 46 | Right |
| Oregon Senate | 15 of 30 | D 100% | 20 D · 10 R | 19 to 22 D | 19 D · 11 R | R 1 | 12 of 13 | Right |
| Pennsylvania House | 203 of 203 | D 94% | 106 D · 97 R | 103 to 115 D | 112 D · 90 R · 1 | D 6 | 134 of 141 | Right |
| Pennsylvania Senate | 25 of 50 | R 88% | 22 D · 28 R | 21 to 24 D | 26 D · 24 R | D 4 | 15 of 19 | Missed |
| Rhode Island House | 75 of 75 | D 100% | 67 D · 8 R | 65 to 68 D | 66 D · 8 R · 1 | R 1 | 12 of 14 | Right |
| Rhode Island Senate | 38 of 38 | D 100% | 36 D · 2 R | 34 to 36 D | 36 D · 2 R | None | 5 of 5 | Right |
| South Carolina House | 124 of 124 | R 100% | 44 D · 80 R | 40 to 51 D | 45 D · 79 R | D 1 | 101 of 104 | Right |
| South Dakota House | 70 of 70 | R 100% | 12 D · 58 R | 6 to 12 D | 6 D · 62 R | R 6 | 26 of 29 | Right |
| South Dakota Senate | 35 of 35 | R 100% | 5 D · 30 R | 4 to 8 D | 2 D · 33 R | R 3 | 11 of 14 | Right |
| Tennessee House | 99 of 99 | R 100% | 28 D · 71 R | 25 to 30 D | 29 D · 69 R · 1 | D 1 | 60 of 63 | Right |
| Tennessee Senate | 17 of 33 | R 100% | 6 D · 27 R | 6 to 6 D | 6 D · 27 R | None | 3 of 3 | Right |
| Texas House | 150 of 150 | R 72% | 68 D · 82 R | 65 to 80 D | 83 D · 67 R | D 15 | 116 of 133 | Missed |
| Texas Senate | 16 of 31 | R 100% | 11 D · 20 R | 11 to 11 D | 12 D · 19 R | D 1 | 9 of 10 | Right |
| Utah House | 75 of 75 | R 100% | 22 D · 53 R | 20 to 26 D | 29 D · 46 R | D 7 | 60 of 67 | Right |
| Utah Senate | 15 of 29 | R 100% | 6 D · 23 R | 6 to 6 D | 8 D · 21 R | D 2 | 4 of 6 | Right |
| Vermont House | 150 of 150 | D 100% | 114 D · 36 R | 109 to 118 D | 97 D · 42 R · 11 | R 17 | 43 of 55 | Right |
| Vermont Senate | 30 of 30 | D 100% | 24 D · 6 R | 22 to 24 D | 21 D · 9 R | R 3 | 11 of 13 | Right |
| Washington House | 98 of 98 | D 100% | 71 D · 27 R | 65 to 73 D | 67 D · 31 R | R 4 | 46 of 51 | Right |
| Washington Senate | 24 of 49 | D 100% | 32 D · 17 R | 31 to 32 D | 31 D · 18 R | R 1 | 11 of 12 | Right |
| Wisconsin Assembly | 99 of 99 | D 69% | 51 D · 48 R | 46 to 54 D | 53 D · 46 R | D 2 | 90 of 92 | Right |
| Wisconsin Senate | 17 of 33 | D 98% | 18 D · 15 R | 17 to 19 D | 18 D · 15 R | None | 15 of 15 | Right |
| West Virginia House of Delegates | 100 of 100 | R 100% | 16 D · 84 R | 12 to 21 D | 21 D · 79 R | D 5 | 77 of 82 | Right |
| West Virginia Senate | 34 of 34 | R 100% | 4 D · 30 R | 16 to 16 D | 3 D · 18 R | R 1 | 15 of 15 | Right |
| Wyoming House | 62 of 62 | R 100% | 8 D · 54 R | 8 to 10 D | 7 D · 55 R | R 1 | 25 of 26 | Right |
| Wyoming Senate | 17 of 31 | R 100% | 3 D · 28 R | 2 to 3 D | 2 D · 29 R | R 1 | 1 of 2 | Right |
Every state, districts called right and the lean of the miss
| State | Districts | Called right | Average miss | Lean | Brier |
|---|---|---|---|---|---|
| Alabama | 50 | 94% | 12.0 | D 11.2 | 0.057 |
| West Virginia | 97 | 95% | 11.1 | D 10.3 | 0.044 |
| Utah | 73 | 88% | 10.7 | D 9.9 | 0.114 |
| Indiana | 94 | 87% | 10.6 | D 9.7 | 0.093 |
| Texas | 143 | 87% | 9.3 | D 8.8 | 0.080 |
| Missouri | 145 | 97% | 8.2 | D 7.8 | 0.026 |
| Pennsylvania | 160 | 93% | 7.6 | D 6.8 | 0.041 |
| Idaho | 88 | 97% | 8.0 | D 6.6 | 0.017 |
| North Carolina | 129 | 91% | 6.9 | D 6.2 | 0.059 |
| Tennessee | 66 | 96% | 7.1 | D 6.0 | 0.032 |
| Rhode Island | 19 | 90% | 7.6 | D 5.7 | 0.051 |
| Wisconsin | 107 | 98% | 4.8 | D 4.2 | 0.010 |
| Nevada | 35 | 100% | 5.5 | D 3.9 | 0.021 |
| New Hampshire | 185 | 86% | 9.8 | D 3.6 | 0.095 |
| Arkansas | 35 | 83% | 5.2 | D 3.5 | 0.110 |
| New Mexico | 28 | 93% | 6.4 | D 3.5 | 0.060 |
| Arizona | 50 | 98% | 8.0 | D 3.0 | 0.030 |
| Georgia | 154 | 91% | 4.4 | D 2.8 | 0.054 |
| South Carolina | 104 | 97% | 4.8 | D 2.7 | 0.026 |
| Illinois | 75 | 96% | 5.7 | D 2.5 | 0.034 |
| Ohio | 101 | 98% | 4.1 | D 2.4 | 0.021 |
| Colorado | 67 | 97% | 4.2 | D 2.3 | 0.025 |
| Iowa | 88 | 97% | 4.2 | D 2.2 | 0.033 |
| California | 79 | 94% | 6.3 | D 2.0 | 0.041 |
| Montana | 106 | 100% | 4.7 | D 1.9 | 0.006 |
| Florida | 107 | 93% | 4.4 | D 1.9 | 0.047 |
| Michigan | 109 | 98% | 3.6 | D 1.8 | 0.023 |
| Oklahoma | 49 | 90% | 12.7 | D 1.6 | 0.080 |
| Kansas | 84 | 92% | 4.7 | D 0.9 | 0.063 |
| Delaware | 28 | 93% | 5.8 | D 0.7 | 0.057 |
| Maryland | 75 | 97% | 7.0 | D 0.5 | 0.022 |
| Alaska | 32 | 91% | 11.1 | R 0.1 | 0.093 |
| Maine | 137 | 91% | 6.2 | R 0.6 | 0.072 |
| New York | 142 | 89% | 10.1 | R 0.8 | 0.082 |
| North Dakota | 35 | 91% | 5.8 | R 1.1 | 0.053 |
| Washington | 63 | 91% | 5.6 | R 1.6 | 0.045 |
| Hawaii | 28 | 89% | 7.8 | R 2.3 | 0.067 |
| Minnesota | 180 | 96% | 4.1 | R 2.4 | 0.038 |
| Connecticut | 138 | 87% | 6.1 | R 2.6 | 0.091 |
| Massachusetts | 46 | 76% | 9.0 | R 2.7 | 0.168 |
| Oregon | 59 | 98% | 6.0 | R 4.5 | 0.015 |
| Vermont | 68 | 79% | 12.3 | R 6.9 | 0.189 |
| Wyoming | 28 | 93% | 13.5 | R 10.7 | 0.053 |
| South Dakota | 43 | 86% | 16.3 | R 10.7 | 0.117 |
The 49 biggest legislative upsets, where the winner had 5 percent or less
| District | Forecast | Winner's chance | Result | Miss | Counted |
|---|---|---|---|---|---|
| Alaska House 34 | R +23.1 | D 0.0% | D +0.7 | D 23.7 | 0% |
| Alabama Senate 10 | R +66.2 | D 0.0% | D +0.1 | D 66.4 | 25% |
| North Carolina House 51 | R +28.8 | D 0.0% | D +1.4 | D 30.2 | 100% |
| Oklahoma House 56 | D +34.1 | R 0.0% | R +44.4 | R 78.5 | 25% |
| New York House 45 | R +23.5 | D 0.0% | D +23.6 | D 47.1 | 100% |
| New York Senate 22 | R +46.9 | D 0.0% | D +28.9 | D 75.8 | 100% |
| New Hampshire House MERRIMACK 013 | R +30.8 | D 0.0% | D +2.7 | D 33.5 | 100% |
| New Hampshire House HILLSBOROUGH 016 | R +26.8 | D 0.0% | D +14.4 | D 41.3 | 100% |
| Vermont House FRANKLIN 1 | D +20.3 | R 0.0% | R +2.1 | R 22.4 | 0% |
| Vermont House ORANGE-WASHINGTON-ADDISON | D +31.5 | R 0.0% | R +11.9 | R 43.4 | 0% |
| Vermont House FRANKLIN 8 | R +22.6 | D 0.1% | D +12.3 | D 34.9 | 0% |
| New York Senate 43 | D +21.8 | R 0.1% | R +0.1 | R 21.9 | 100% |
| Vermont House ORLEANS 2 | D +19.8 | R 0.1% | R +10.5 | R 30.3 | 0% |
| Utah House 38 | R +18.4 | D 0.4% | D +14.3 | D 32.7 | 93% |
| Vermont House CHITTENDEN-FRANKLIN | R +19.1 | D 0.4% | D +1.7 | D 20.8 | 0% |
| Missouri House 60 | R +16.4 | D 0.4% | D +1.5 | D 18.0 | 93% |
| New York Senate 54 | D +17.1 | R 0.4% | R +17.1 | R 34.2 | 100% |
| Connecticut House 14 | D +16.4 | R 0.4% | R +4.5 | R 21.0 | 100% |
| Kansas House 123 | R +16.4 | D 0.4% | D +1.6 | D 18.0 | 100% |
| Maine House 45 | R +17.2 | D 0.5% | D +5.7 | D 22.9 | 56% |
| West Virginia House 27 | R +17.7 | D 0.5% | D +16.5 | D 34.1 | 100% |
| Connecticut House 149 | D +16.9 | R 0.7% | R +3.7 | R 20.5 | 100% |
| West Virginia House 12 | R +16.2 | D 0.7% | D +4.2 | D 20.4 | 100% |
| Massachusetts House 2ND PLYMOUTH | R +16.1 | D 0.7% | D +0.5 | D 16.6 | 100% |
| Delaware House 22 | D +15.5 | R 0.7% | R +7.6 | R 23.1 | 100% |
| New Hampshire House ROCKINGHAM 013 | R +16.4 | D 0.8% | D +3.7 | D 20.0 | 100% |
| Alaska House 5 | R +14.7 | D 0.8% | D +11.1 | D 25.8 | 0% |
| Utah Senate 5 | R +15.9 | D 1.0% | D +11.1 | D 26.9 | 100% |
| Vermont House CALEDONIA-WASHINGTON | D +14.6 | R 1.3% | R +9.6 | R 24.1 | 0% |
| Connecticut House 125 | D +13.8 | R 1.4% | R +2.4 | R 16.2 | 100% |
| Maine House 96 | D +14.6 | R 1.5% | R +0.7 | R 15.3 | 50% |
| South Dakota Senate 27 | D +14.5 | R 1.7% | R +4.4 | R 18.9 | 100% |
| New Hampshire House STRAFFORD 005 | R +13.7 | D 2.0% | D +14.3 | D 28.0 | 100% |
| Wyoming House 41 | D +14.5 | R 2.1% | R +17.0 | R 31.5 | 0% |
| Indiana House 90 | R +13.0 | D 2.3% | D +2.2 | D 15.2 | 95% |
| Utah Senate 19 | R +12.4 | D 2.8% | D +11.1 | D 23.5 | 95% |
| Maine House 107 | R +12.9 | D 2.9% | D +6.6 | D 19.5 | 50% |
| Massachusetts House 9TH ESSEX | D +12.8 | R 3.1% | R +10.1 | R 22.8 | 100% |
| Utah House 62 | R +11.8 | D 3.5% | D +11.1 | D 23.0 | 100% |
| Texas Senate 9 | R +11.9 | D 3.5% | D +2.5 | D 14.4 | 100% |
| California House 74 | D +11.4 | R 4.2% | R +0.5 | R 11.9 | 100% |
| Utah House 48 | R +10.9 | D 4.2% | D +2.6 | D 13.5 | 94% |
| Texas House 89 | R +11.6 | D 4.5% | D +1.6 | D 13.2 | 100% |
| Texas House 14 | R +10.4 | D 4.7% | D +0.5 | D 10.9 | 100% |
| New York Senate 45 | D +10.7 | R 4.7% | R +11.8 | R 22.5 | 100% |
| South Dakota House 27 | D +11.1 | R 4.8% | D +32.7 | D 21.6 | 100% |
| South Dakota Senate 32 | D +10.9 | R 4.9% | R +4.8 | R 15.7 | 93% |
| Utah House 3 | R +10.8 | D 4.9% | D +16.2 | D 27.0 | 100% |
| Alaska House 11 | D +10.9 | R 5.0% | R +7.0 | R 17.9 | 0% |
What we got wrong
The misses, and what they point to for 2028
The statewide races that missed
- Nebraska Senate: forecast I +2.0, Pete Ricketts won by 6.5.
- Alaska Senate: forecast D +5.1, Dan S. Sullivan leads by 0.9, 72% counted.
- Mississippi Senate: forecast R +0.5, Scott Colom leads by a handful of votes, 97% counted.
- Texas Governor: forecast R +0.2, Gina Hinojosa won by 7.0.
The biggest statewide margin misses
- Wyoming Governor: R 24.4 points, forecast R +29.6 and result R +53.9.
- Hawaii Governor: D 14.7 points, forecast D +35.1 and result D +49.9.
- Oregon Senate: R 13.3 points, forecast D +29.3 and result D +16.1.
- South Dakota Governor: R 12.3 points, forecast R +14.7 and result R +27.0.
- Illinois Senate: D 9.8 points, forecast D +17.8 and result D +27.6.
Patterns in the miss
- Democrats ran ahead of the forecast across the map: the lean of the miss was D 1.1 in all 479 scored races and D 2.4 in the 133 within 10 points.
- The pull was strongest where Republicans were safest. In legislative districts the forecast had at R +40 or more, Democrats ran 7.2 points ahead on average, even as the forecast still called 405 of 407 of them.
- The Southwest was the hardest region for the county model: a vote weighted miss of 8.3 points and a lean of D 5.0. Suburban counties leaned D 2.5.
- The federal odds were cautious in the middle and the legislative odds a little confident at the top, as the calibration chart shows. One spread for every office did not fit both.
- In the House races within 10 points, favorites won 79 percent against an average forecast chance of 69 percent.
What the misses point to
- Separate spreads for federal and legislative races, each fit to this year's calibration.
- A regional swing term that can move the Southwest and the South on their own.
- A wider tail for safe seats, where the miss was largest.
- Independent candidates modeled on their own, not as stand in Democrats.
Share it
The graphics
Open any card for the full size image.
Method
How the grade is built
The forecast side is the frozen copy of the November 3 forecast in the final forecast archive, the same bytes the site served on Election Day, each file hashed so anyone can check it. The results side is the count from the On Point results desk, read November 4 at 5:15 AM ET for federal and governor races and November 5 at 11:39 PM ET for legislatures.
Margins are the Republican share minus the Democratic share of all votes. The miss is the result minus the forecast. A race is called right when the forecast's favorite, the side with more than half the simulated wins, leads the count. Odds are the published odds, after the November 3 widening of the spread.
Races still counting are scored on the current count and marked counting. This page is rebuilt as the count finishes, from the same frozen forecast.
17 federal races had only one major party on the count, most of them unopposed, so they count toward calls but not toward margins or odds.
Left out of the margin and odds scores
- Alaska Senate: Alaska first round count, ranked choice still to run.
- Alaska Governor: Alaska first round count, ranked choice still to run.
- Rhode Island Governor: The main rival was an independent, not the Republican.
- Alaska at-large: Alaska first round count, ranked choice still to run.
- Louisiana 2nd: Louisiana count lists several candidates per party.
- Louisiana 6th: Louisiana count lists several candidates per party.
- Louisiana 5th: Louisiana count lists several candidates per party.
- Louisiana 4th: Louisiana count lists several candidates per party.
- Louisiana 3rd: Louisiana count lists several candidates per party.
- Louisiana 1st: Louisiana count lists several candidates per party.
Scores built November 6 at 9:34 AM ET. The full file has every race, county summary, chamber and legislative upset on this page.