Pollster accuracy · 2026 midterms
The most accurate pollster of 2026: On Point Polling.
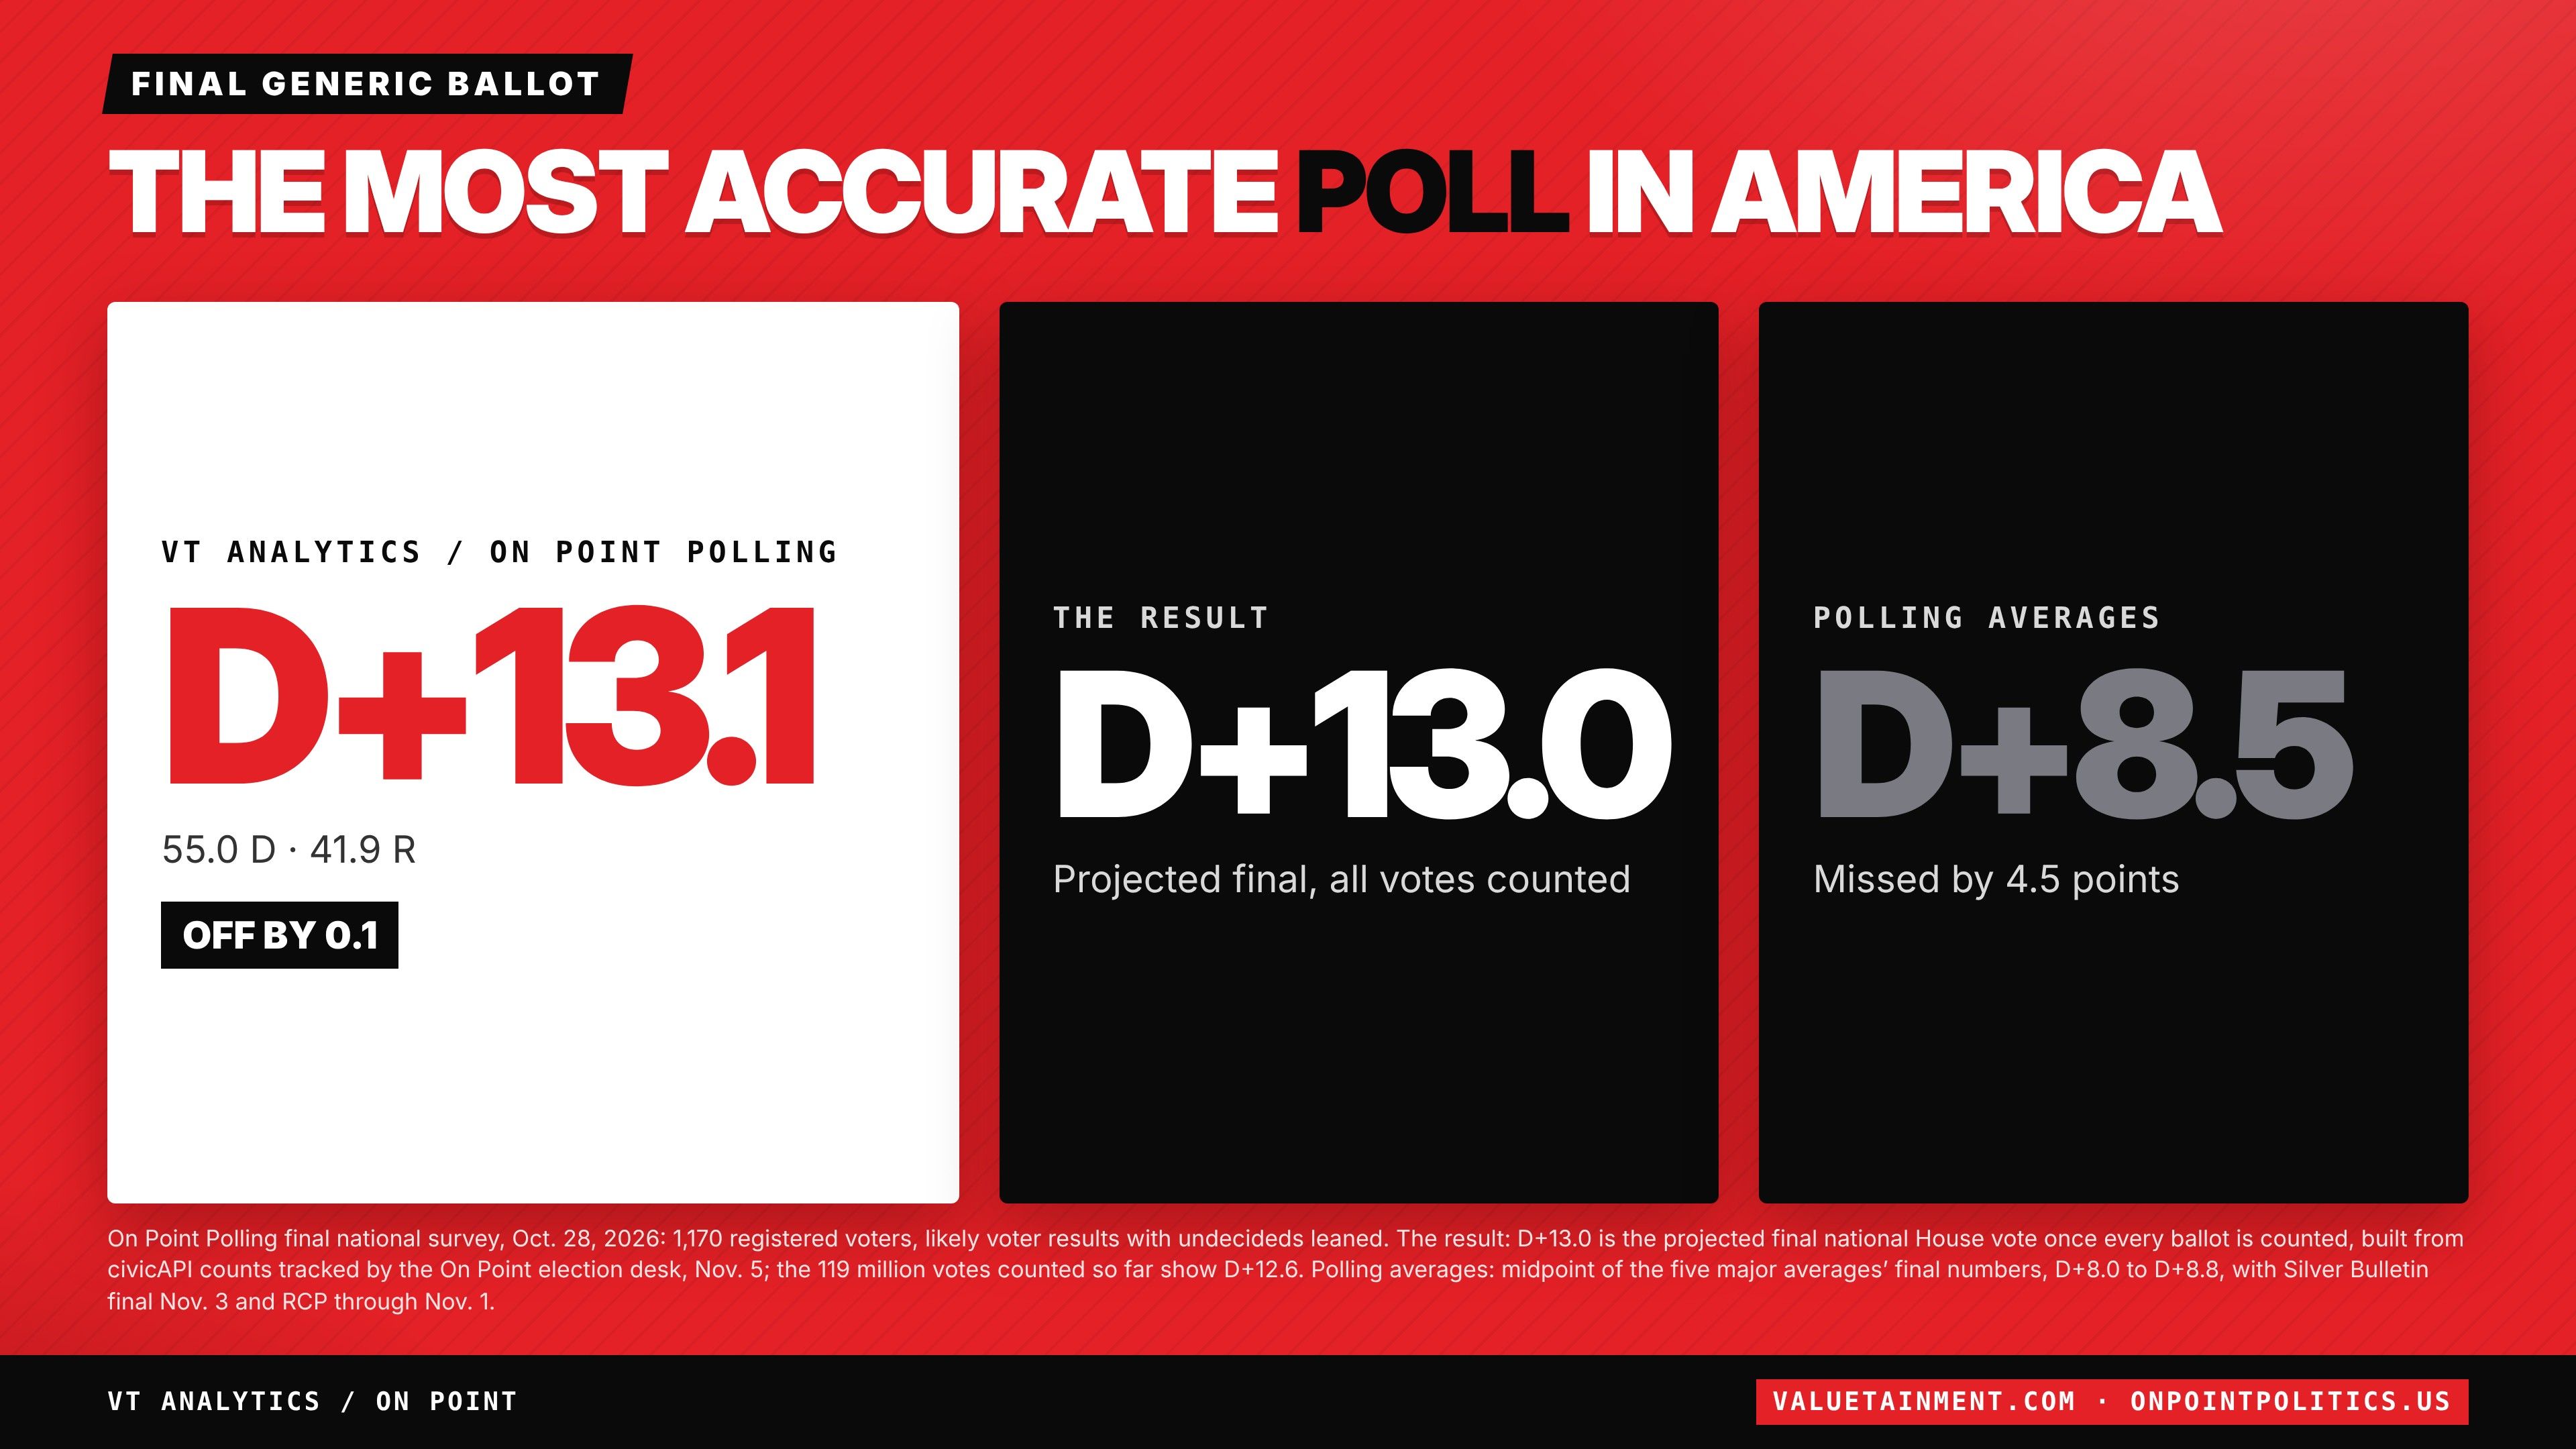
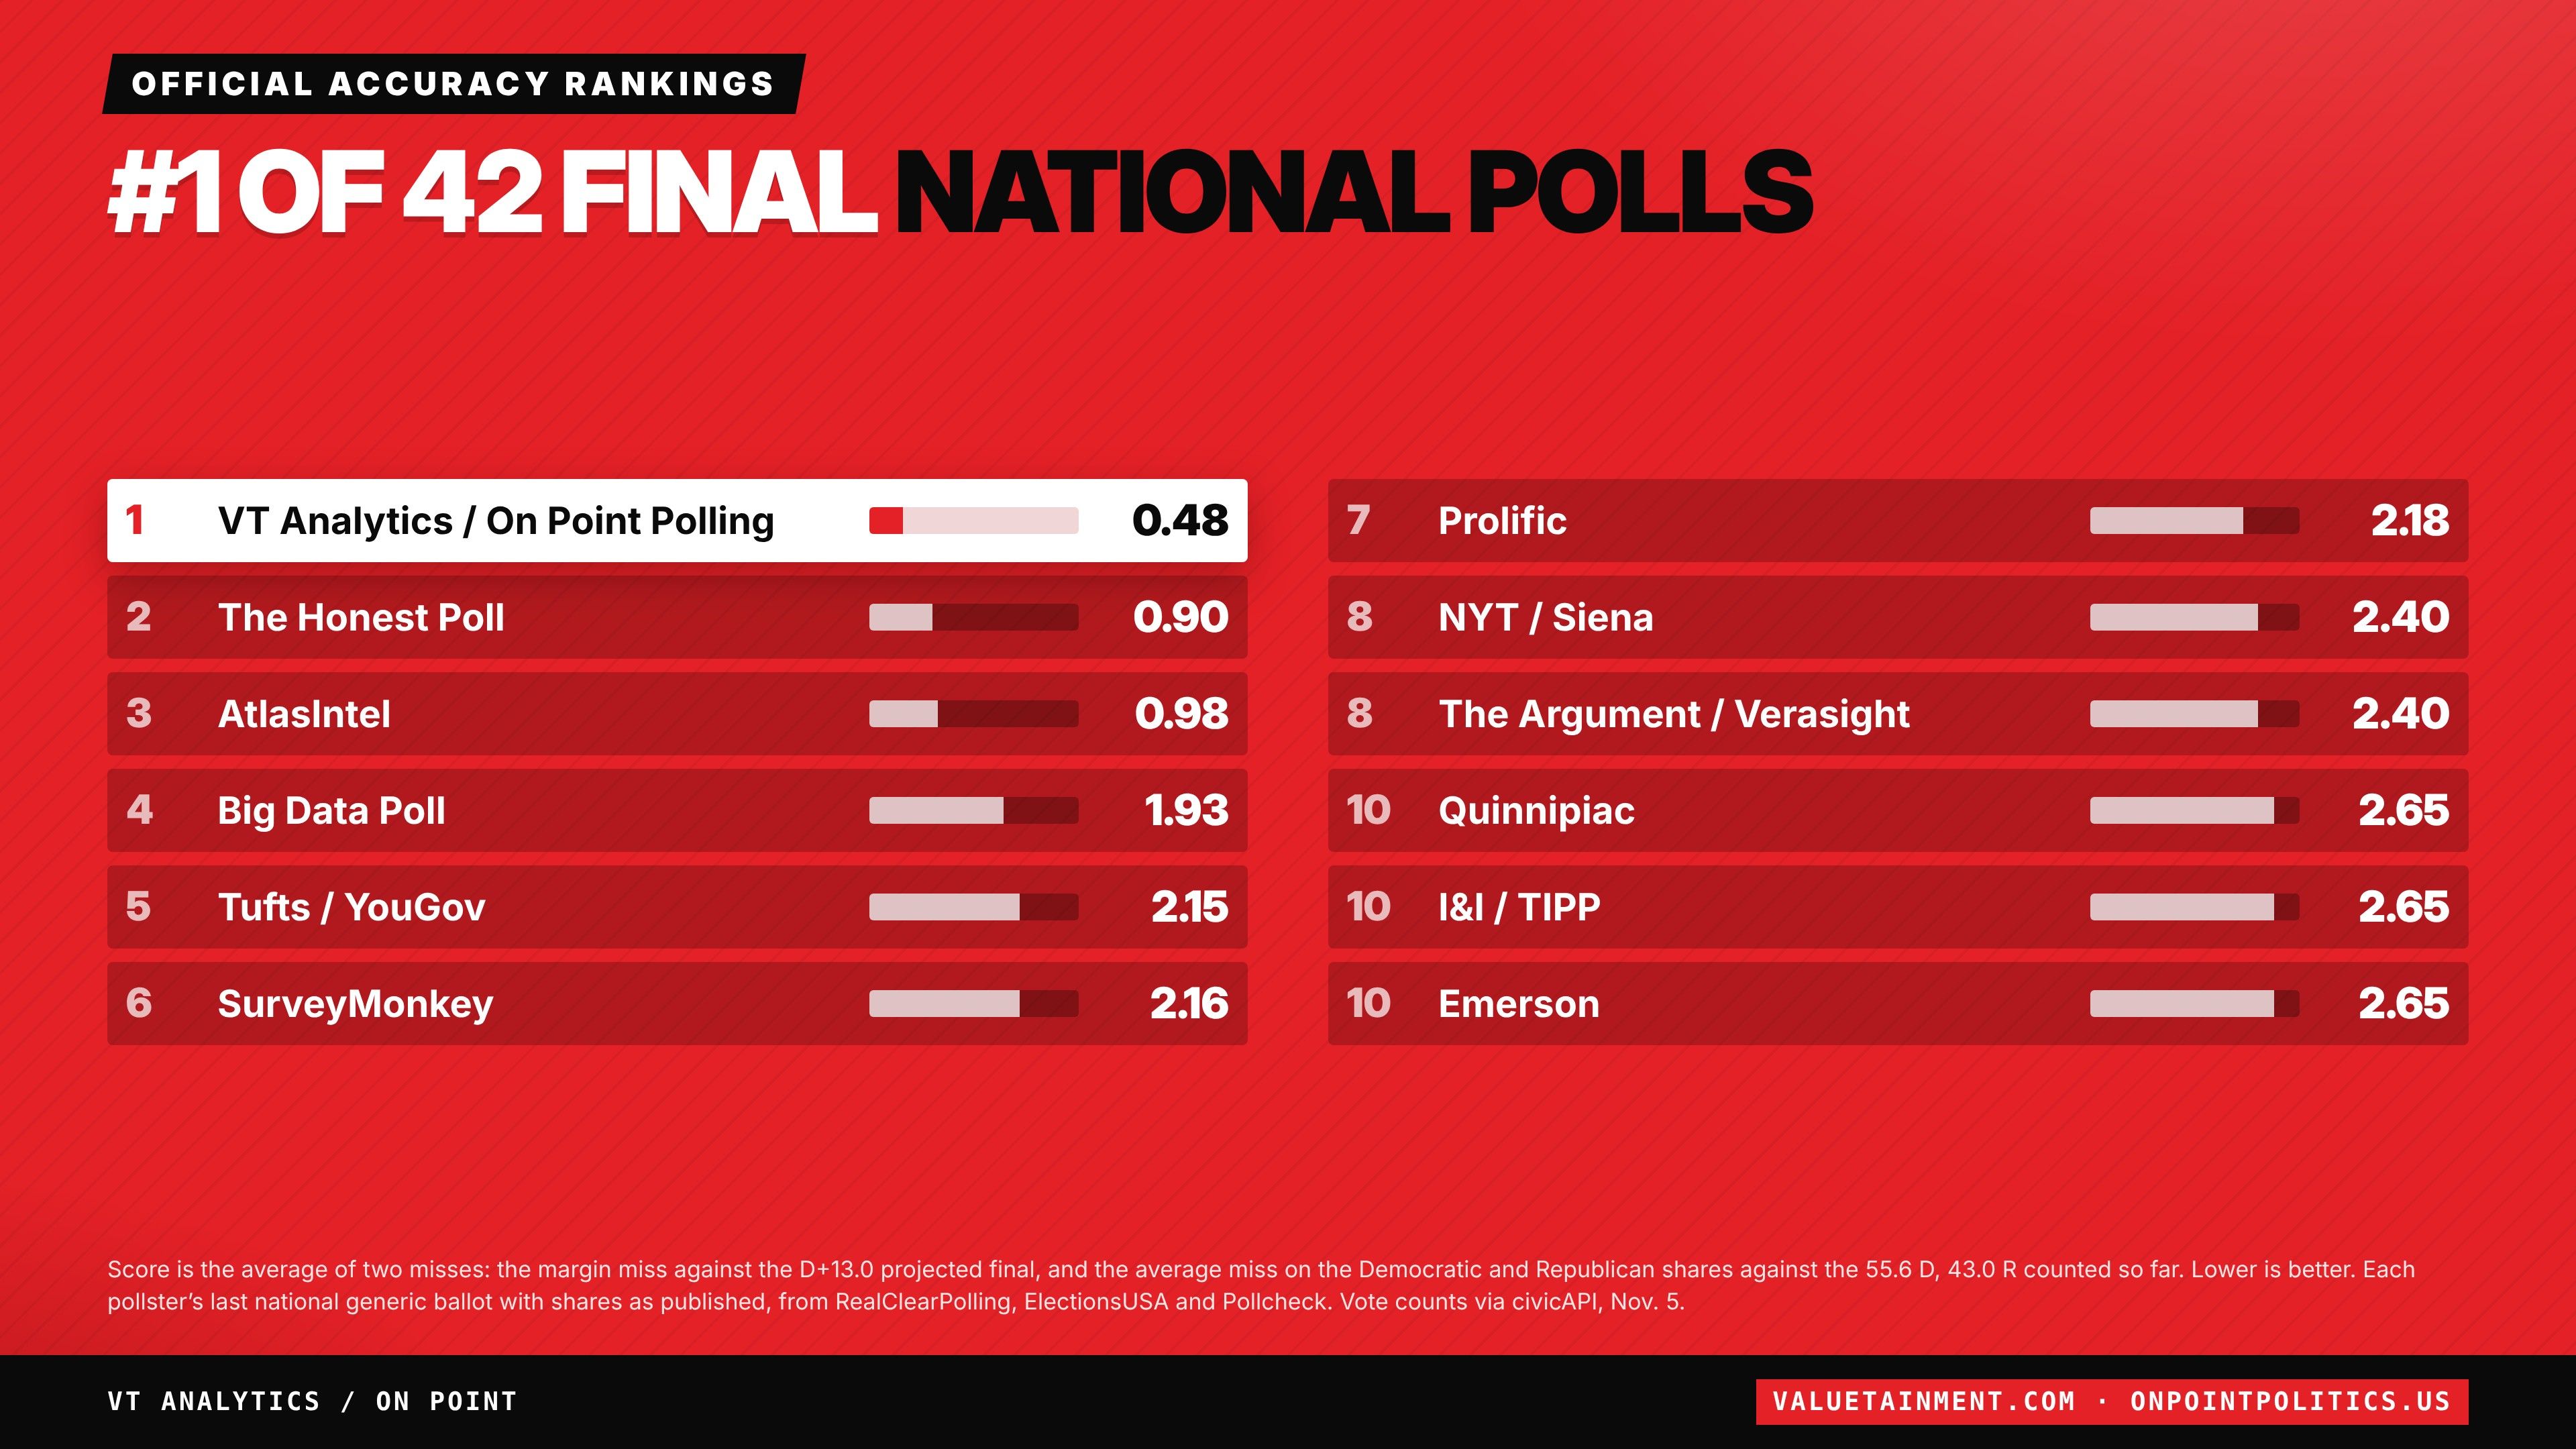
Our final national poll had Democrats ahead 55.0 to 41.9, a margin of 13.1. The projected final is D +13.0. Scored on both the margin and the party shares, that puts On Point Polling first of 42 final national polls, with a score of 0.48 against 0.90 for the next closest. The polling averages finished near D +8.5.
On Point Polling final national poll
55.0 D · 41.9 R
Off by 0.1The result
Projected final, all votes counted
Polling averages
Missed by 4.5 points
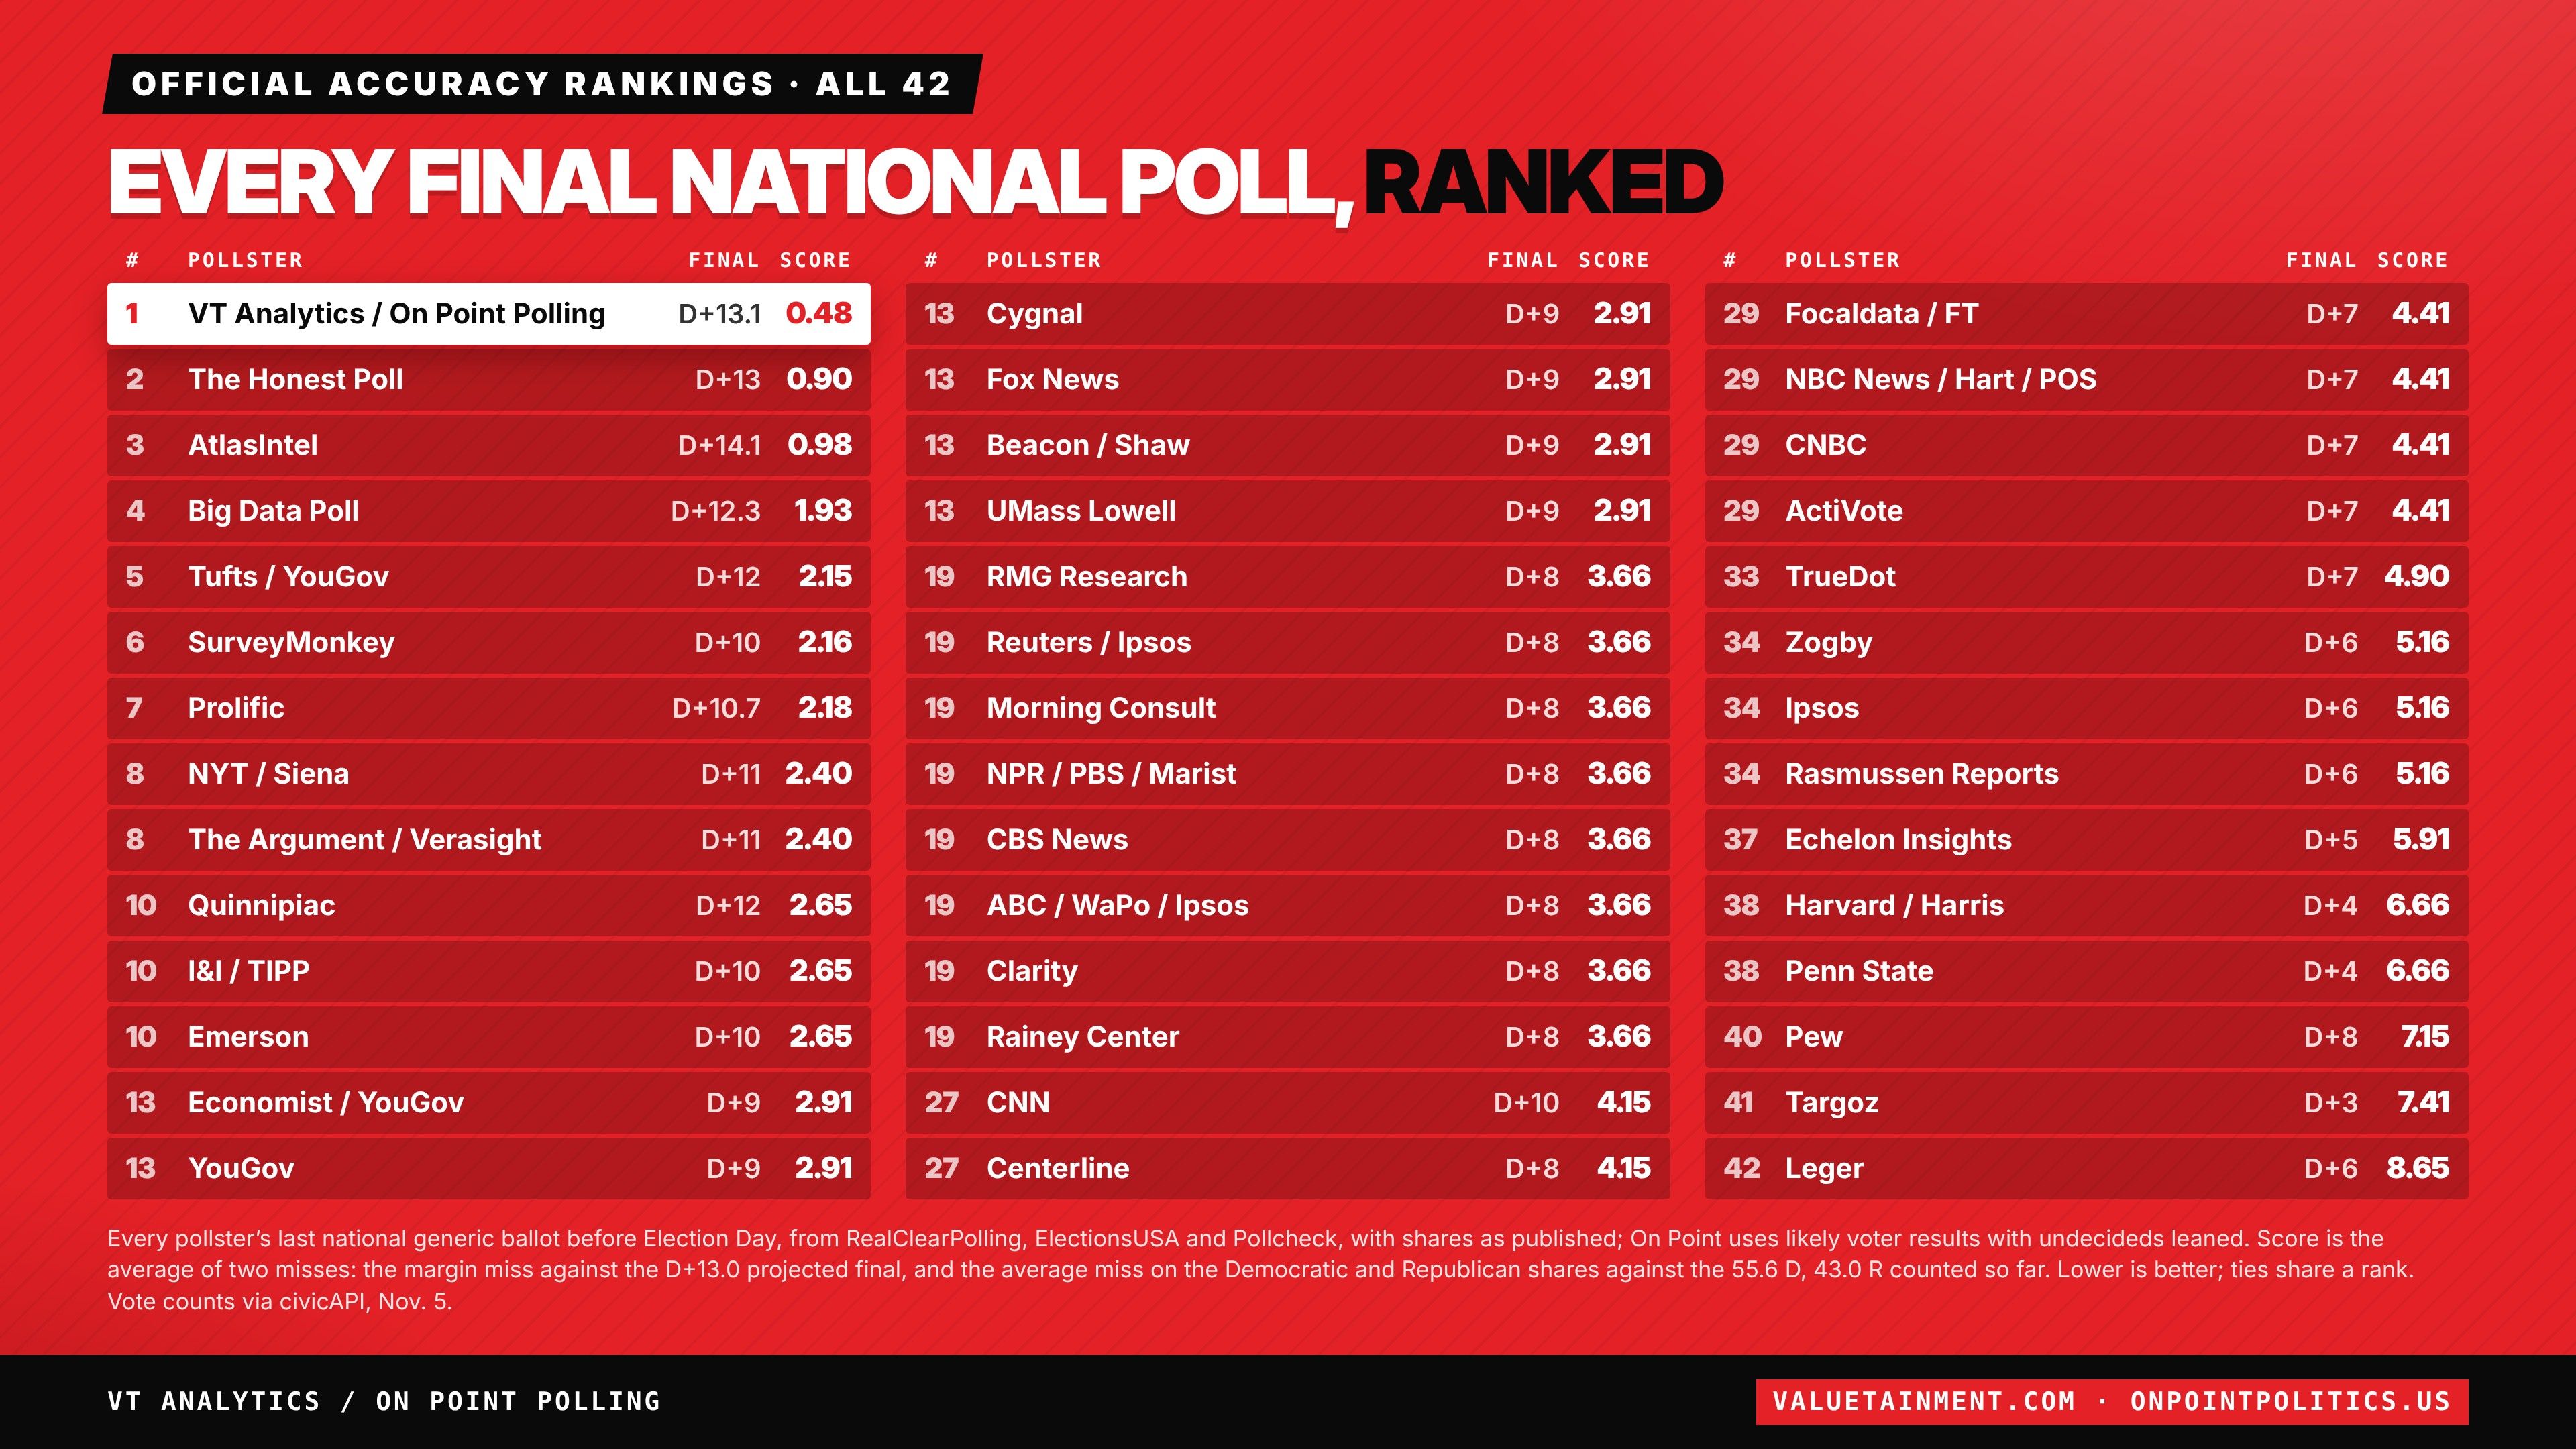
Every final national poll, ranked
42 final national polls
Each pollster's last national generic ballot before Election Day. Lower scores are better.
| Rank | Pollster | Final poll | Margin miss | Score |
|---|---|---|---|---|
| 1 | VT Analytics / On Point Polling | D +13.1 | 0.1 | 0.48 |
| 2 | The Honest Poll | D +13 | 0.0 | 0.90 |
| 3 | AtlasIntel | D +14.1 | 1.1 | 0.98 |
| 4 | Big Data Poll | D +12.3 | 0.7 | 1.93 |
| 5 | Tufts / YouGov | D +12 | 1.0 | 2.15 |
| 6 | SurveyMonkey | D +10 | 3.0 | 2.16 |
| 7 | Prolific | D +10.7 | 2.3 | 2.18 |
| 8 | NYT / Siena | D +11 | 2.0 | 2.40 |
| 8 | The Argument / Verasight | D +11 | 2.0 | 2.40 |
| 10 | Quinnipiac | D +12 | 1.0 | 2.65 |
| 10 | I&I / TIPP | D +10 | 3.0 | 2.65 |
| 10 | Emerson | D +10 | 3.0 | 2.65 |
| 13 | Economist / YouGov | D +9 | 4.0 | 2.91 |
| 13 | YouGov | D +9 | 4.0 | 2.91 |
| 13 | Cygnal | D +9 | 4.0 | 2.91 |
| 13 | Fox News | D +9 | 4.0 | 2.91 |
| 13 | Beacon / Shaw | D +9 | 4.0 | 2.91 |
| 13 | UMass Lowell | D +9 | 4.0 | 2.91 |
| 19 | RMG Research | D +8 | 5.0 | 3.66 |
| 19 | Reuters / Ipsos | D +8 | 5.0 | 3.66 |
| 19 | Morning Consult | D +8 | 5.0 | 3.66 |
| 19 | NPR / PBS / Marist | D +8 | 5.0 | 3.66 |
| 19 | CBS News | D +8 | 5.0 | 3.66 |
| 19 | ABC / WaPo / Ipsos | D +8 | 5.0 | 3.66 |
| 19 | Clarity | D +8 | 5.0 | 3.66 |
| 19 | Rainey Center | D +8 | 5.0 | 3.66 |
| 27 | CNN | D +10 | 3.0 | 4.15 |
| 27 | Centerline | D +8 | 5.0 | 4.15 |
| 29 | Focaldata / FT | D +7 | 6.0 | 4.41 |
| 29 | NBC News / Hart / POS | D +7 | 6.0 | 4.41 |
| 29 | CNBC | D +7 | 6.0 | 4.41 |
| 29 | ActiVote | D +7 | 6.0 | 4.41 |
| 33 | TrueDot | D +7 | 6.0 | 4.90 |
| 34 | Zogby | D +6 | 7.0 | 5.16 |
| 34 | Ipsos | D +6 | 7.0 | 5.16 |
| 34 | Rasmussen Reports | D +6 | 7.0 | 5.16 |
| 37 | Echelon Insights | D +5 | 8.0 | 5.91 |
| 38 | Harvard / Harris | D +4 | 9.0 | 6.66 |
| 38 | Penn State | D +4 | 9.0 | 6.66 |
| 40 | Pew | D +8 | 5.0 | 7.15 |
| 41 | Targoz | D +3 | 10.0 | 7.41 |
| 42 | Leger | D +6 | 7.0 | 8.65 |
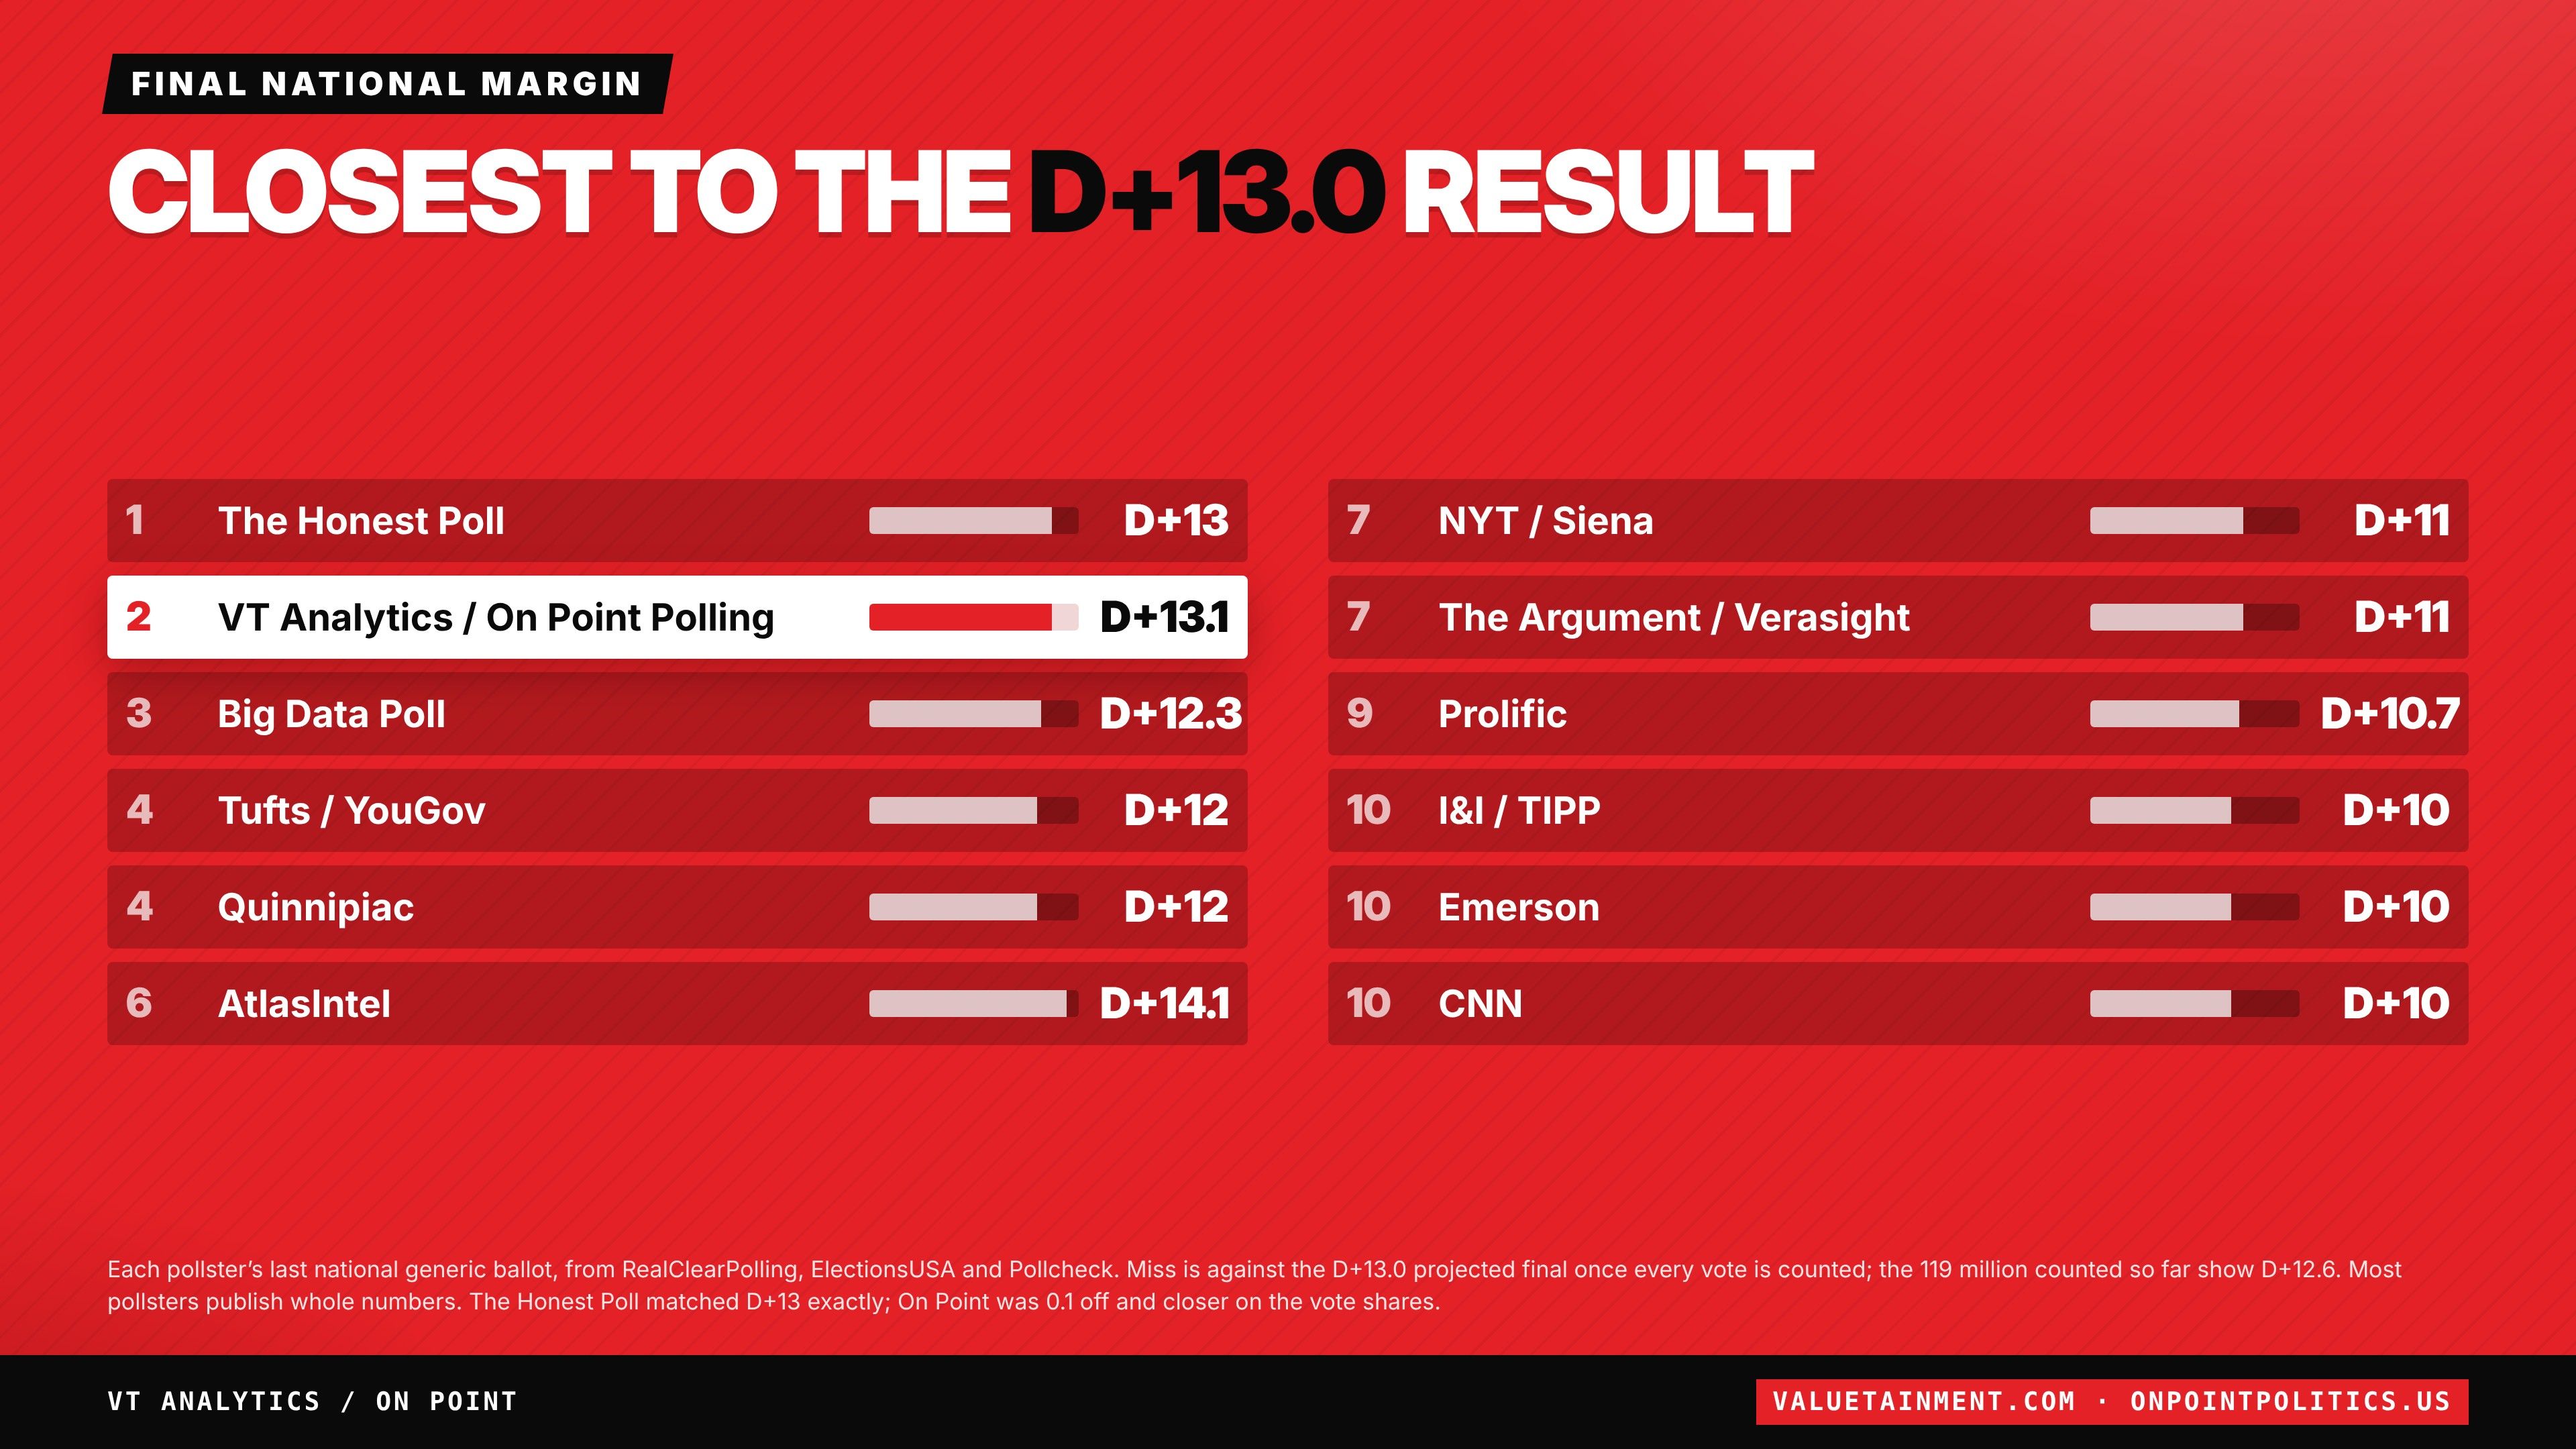
Score is the average of two misses: the margin miss against the D+13.0 projected final, and the average miss on the Democratic and Republican shares against the 55.6 D, 43.0 R counted so far. Lower is better; ties share a rank. Each pollster's last national generic ballot before Election Day with shares as published, from RealClearPolling, ElectionsUSA and Pollcheck. On Point uses its likely voter results with undecideds leaned. On the margin alone The Honest Poll matched D +13 exactly and On Point was 0.1 off; most pollsters publish whole numbers. The D +13.0 result is the projected final once every vote is counted; the 119 million votes counted by the evening of November 5 show D +12.6. On Point's final poll: 1,170 registered voters, fielded October 28, 2026, registered voters, likely voter results with undecideds leaned.
The forecast, too
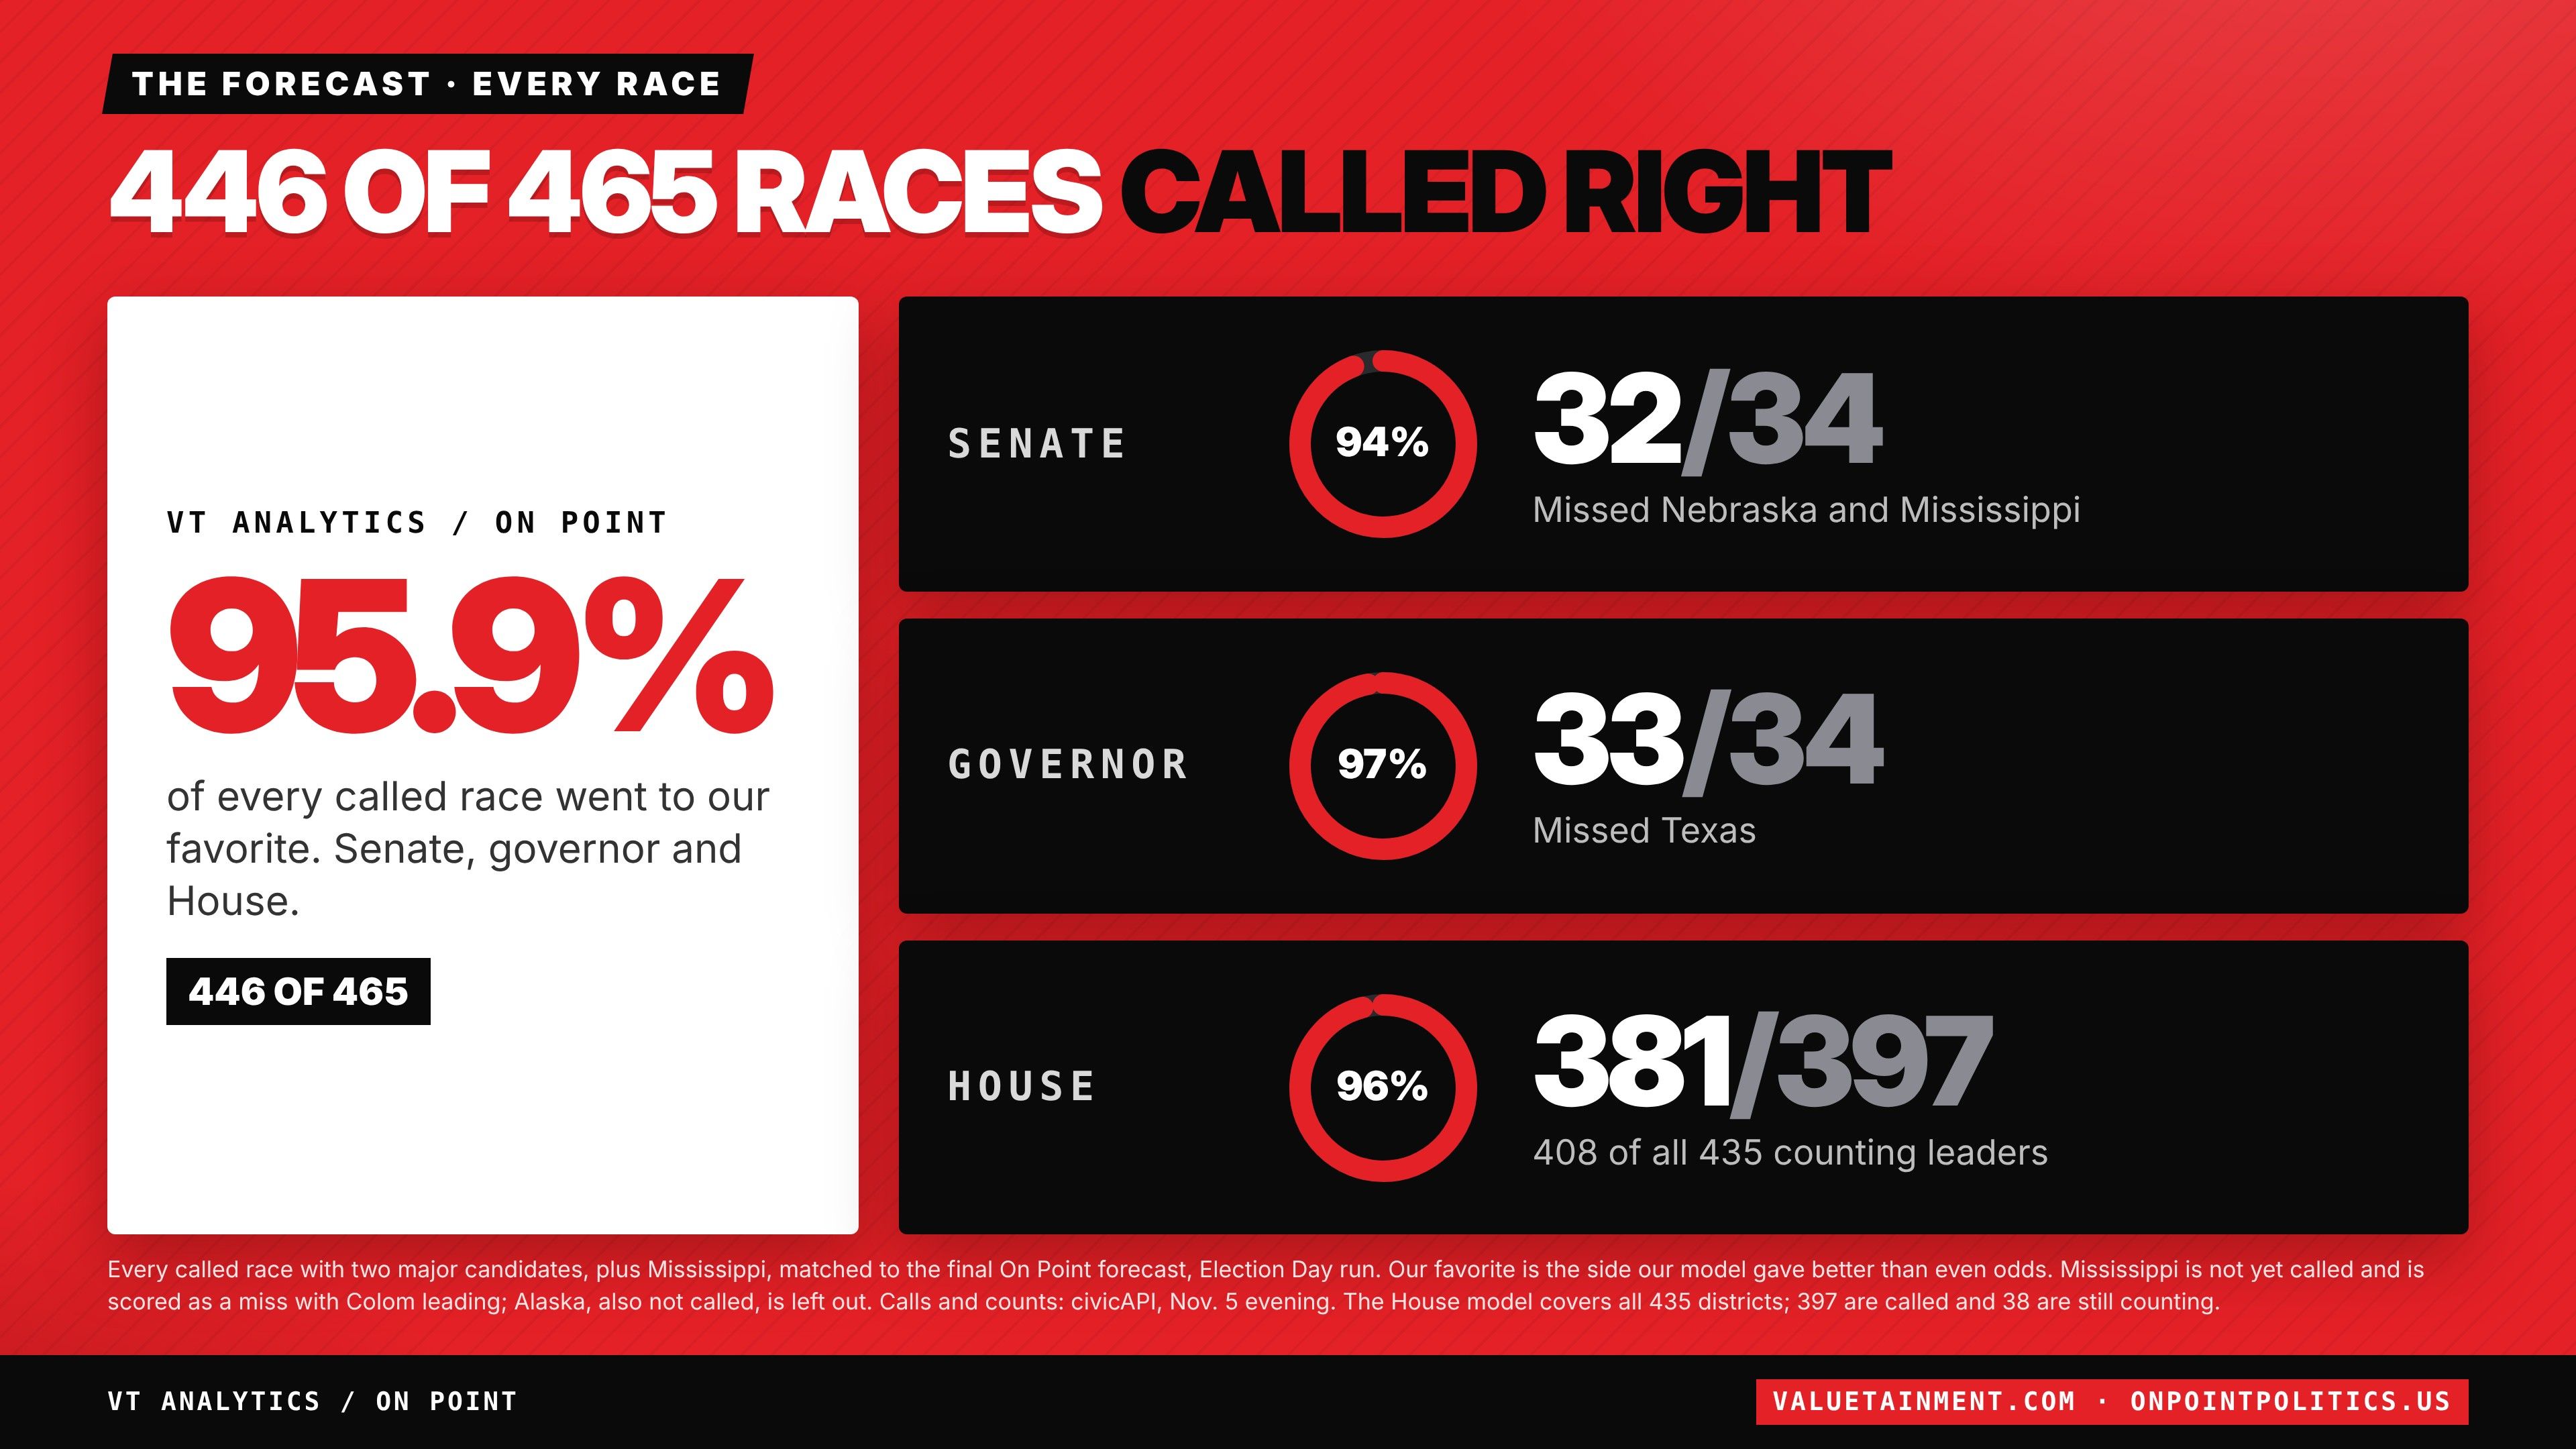
476 of 506 races called right, and all three chambers
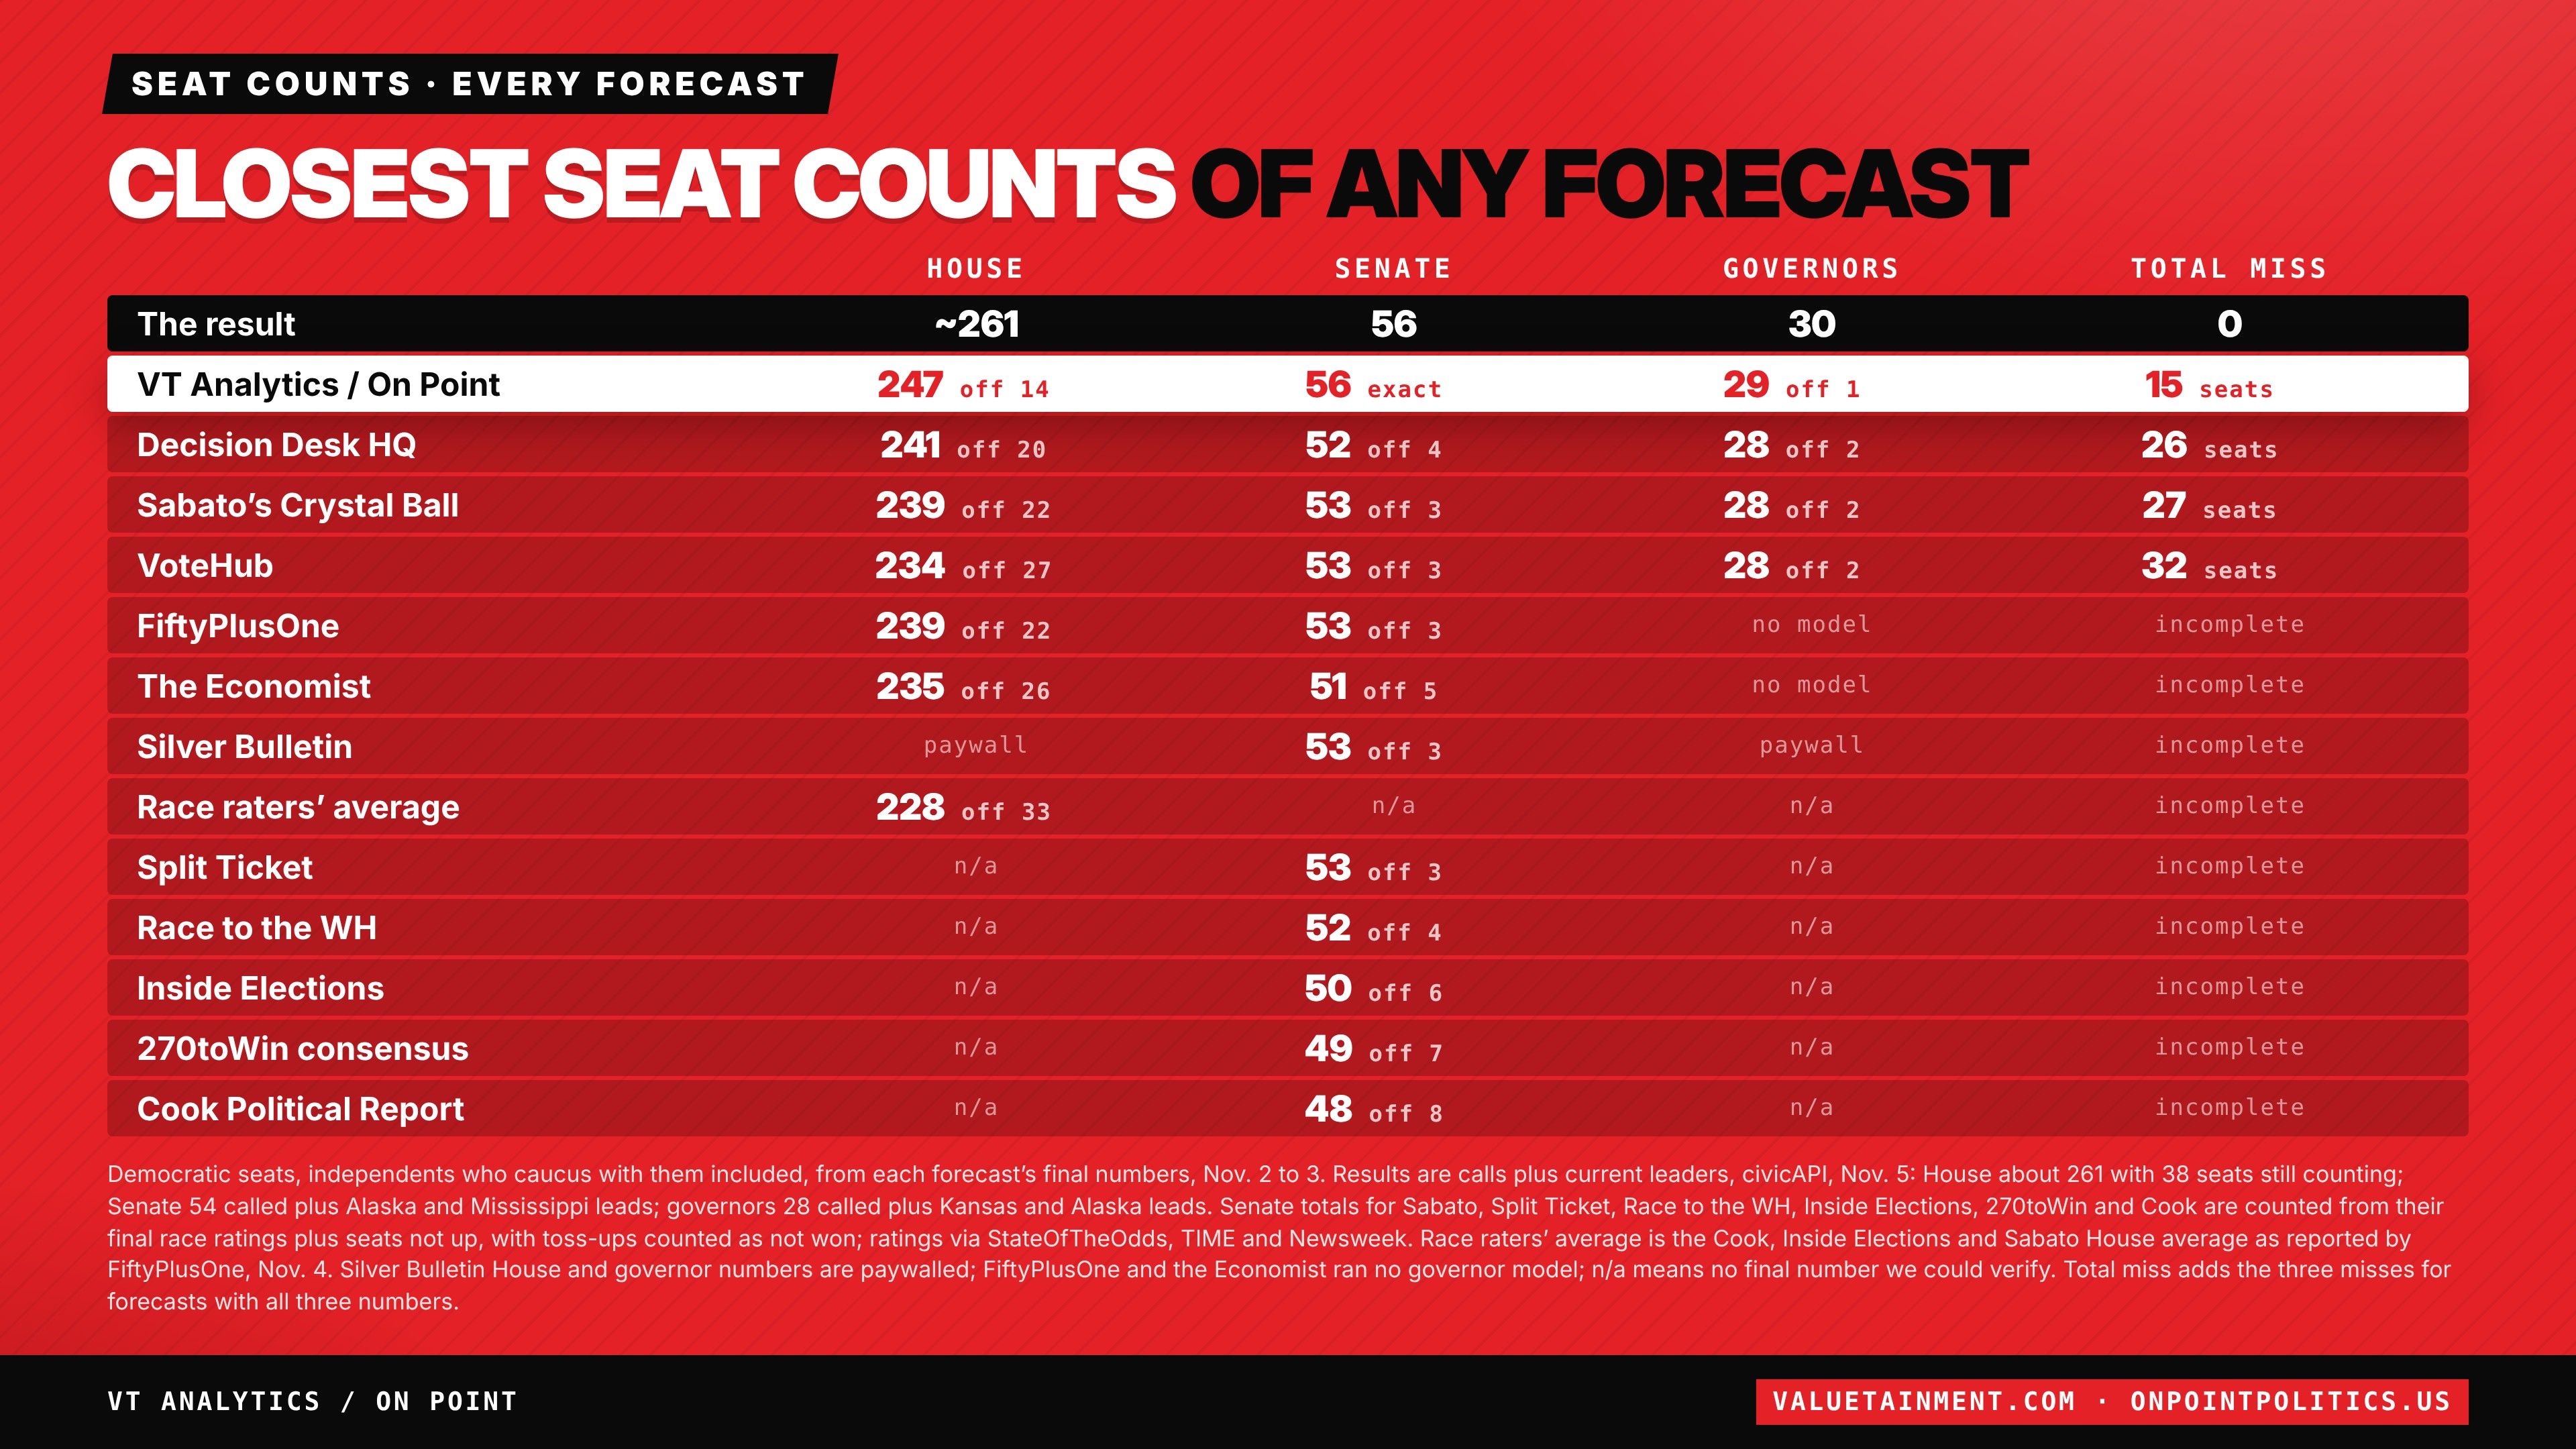
The same polling fed the On Point forecast, which gave the closest final seat counts of any forecast that published them.
| Forecast | House | Senate | Governors | Total miss |
|---|---|---|---|---|
| The result | about 261 | 56 | 30 | 0 |
| VT Analytics / On Point | 247 off 14 | 56 exact | 29 off 1 | 15 seats |
| Decision Desk HQ | 241 off 20 | 52 off 4 | 28 off 2 | 26 seats |
| Sabato's Crystal Ball | 239 off 22 | 53 off 3 | 28 off 2 | 27 seats |
| VoteHub | 234 off 27 | 53 off 3 | 28 off 2 | 32 seats |
| FiftyPlusOne | 239 off 22 | 53 off 3 | no model | incomplete |
| The Economist | 235 off 26 | 51 off 5 | no model | incomplete |
| Silver Bulletin | paywall | 53 off 3 | paywall | incomplete |
| Race raters' average | 228 off 33 | no number | no number | incomplete |
| Split Ticket | no number | 53 off 3 | no number | incomplete |
| Race to the WH | no number | 52 off 4 | no number | incomplete |
| Inside Elections | no number | 50 off 6 | no number | incomplete |
| 270toWin consensus | no number | 49 off 7 | no number | incomplete |
| Cook Political Report | no number | 48 off 8 | no number | incomplete |
Democratic seats, independents who caucus with them included, from each forecast's final numbers, November 2 to 3. Results are calls plus current leaders: House about 261 with 38 seats still counting; Senate 54 called plus the Alaska and Mississippi leaders; governors 28 called plus the Kansas and Alaska leaders. Senate totals for Sabato, Split Ticket, Race to the WH, Inside Elections, 270toWin and Cook are counted from their final race ratings plus seats not up, with toss ups counted as not won. The race raters' average is the Cook, Inside Elections and Sabato House average. Silver Bulletin House and governor numbers are paywalled; FiftyPlusOne and the Economist ran no governor model.
What else we got right
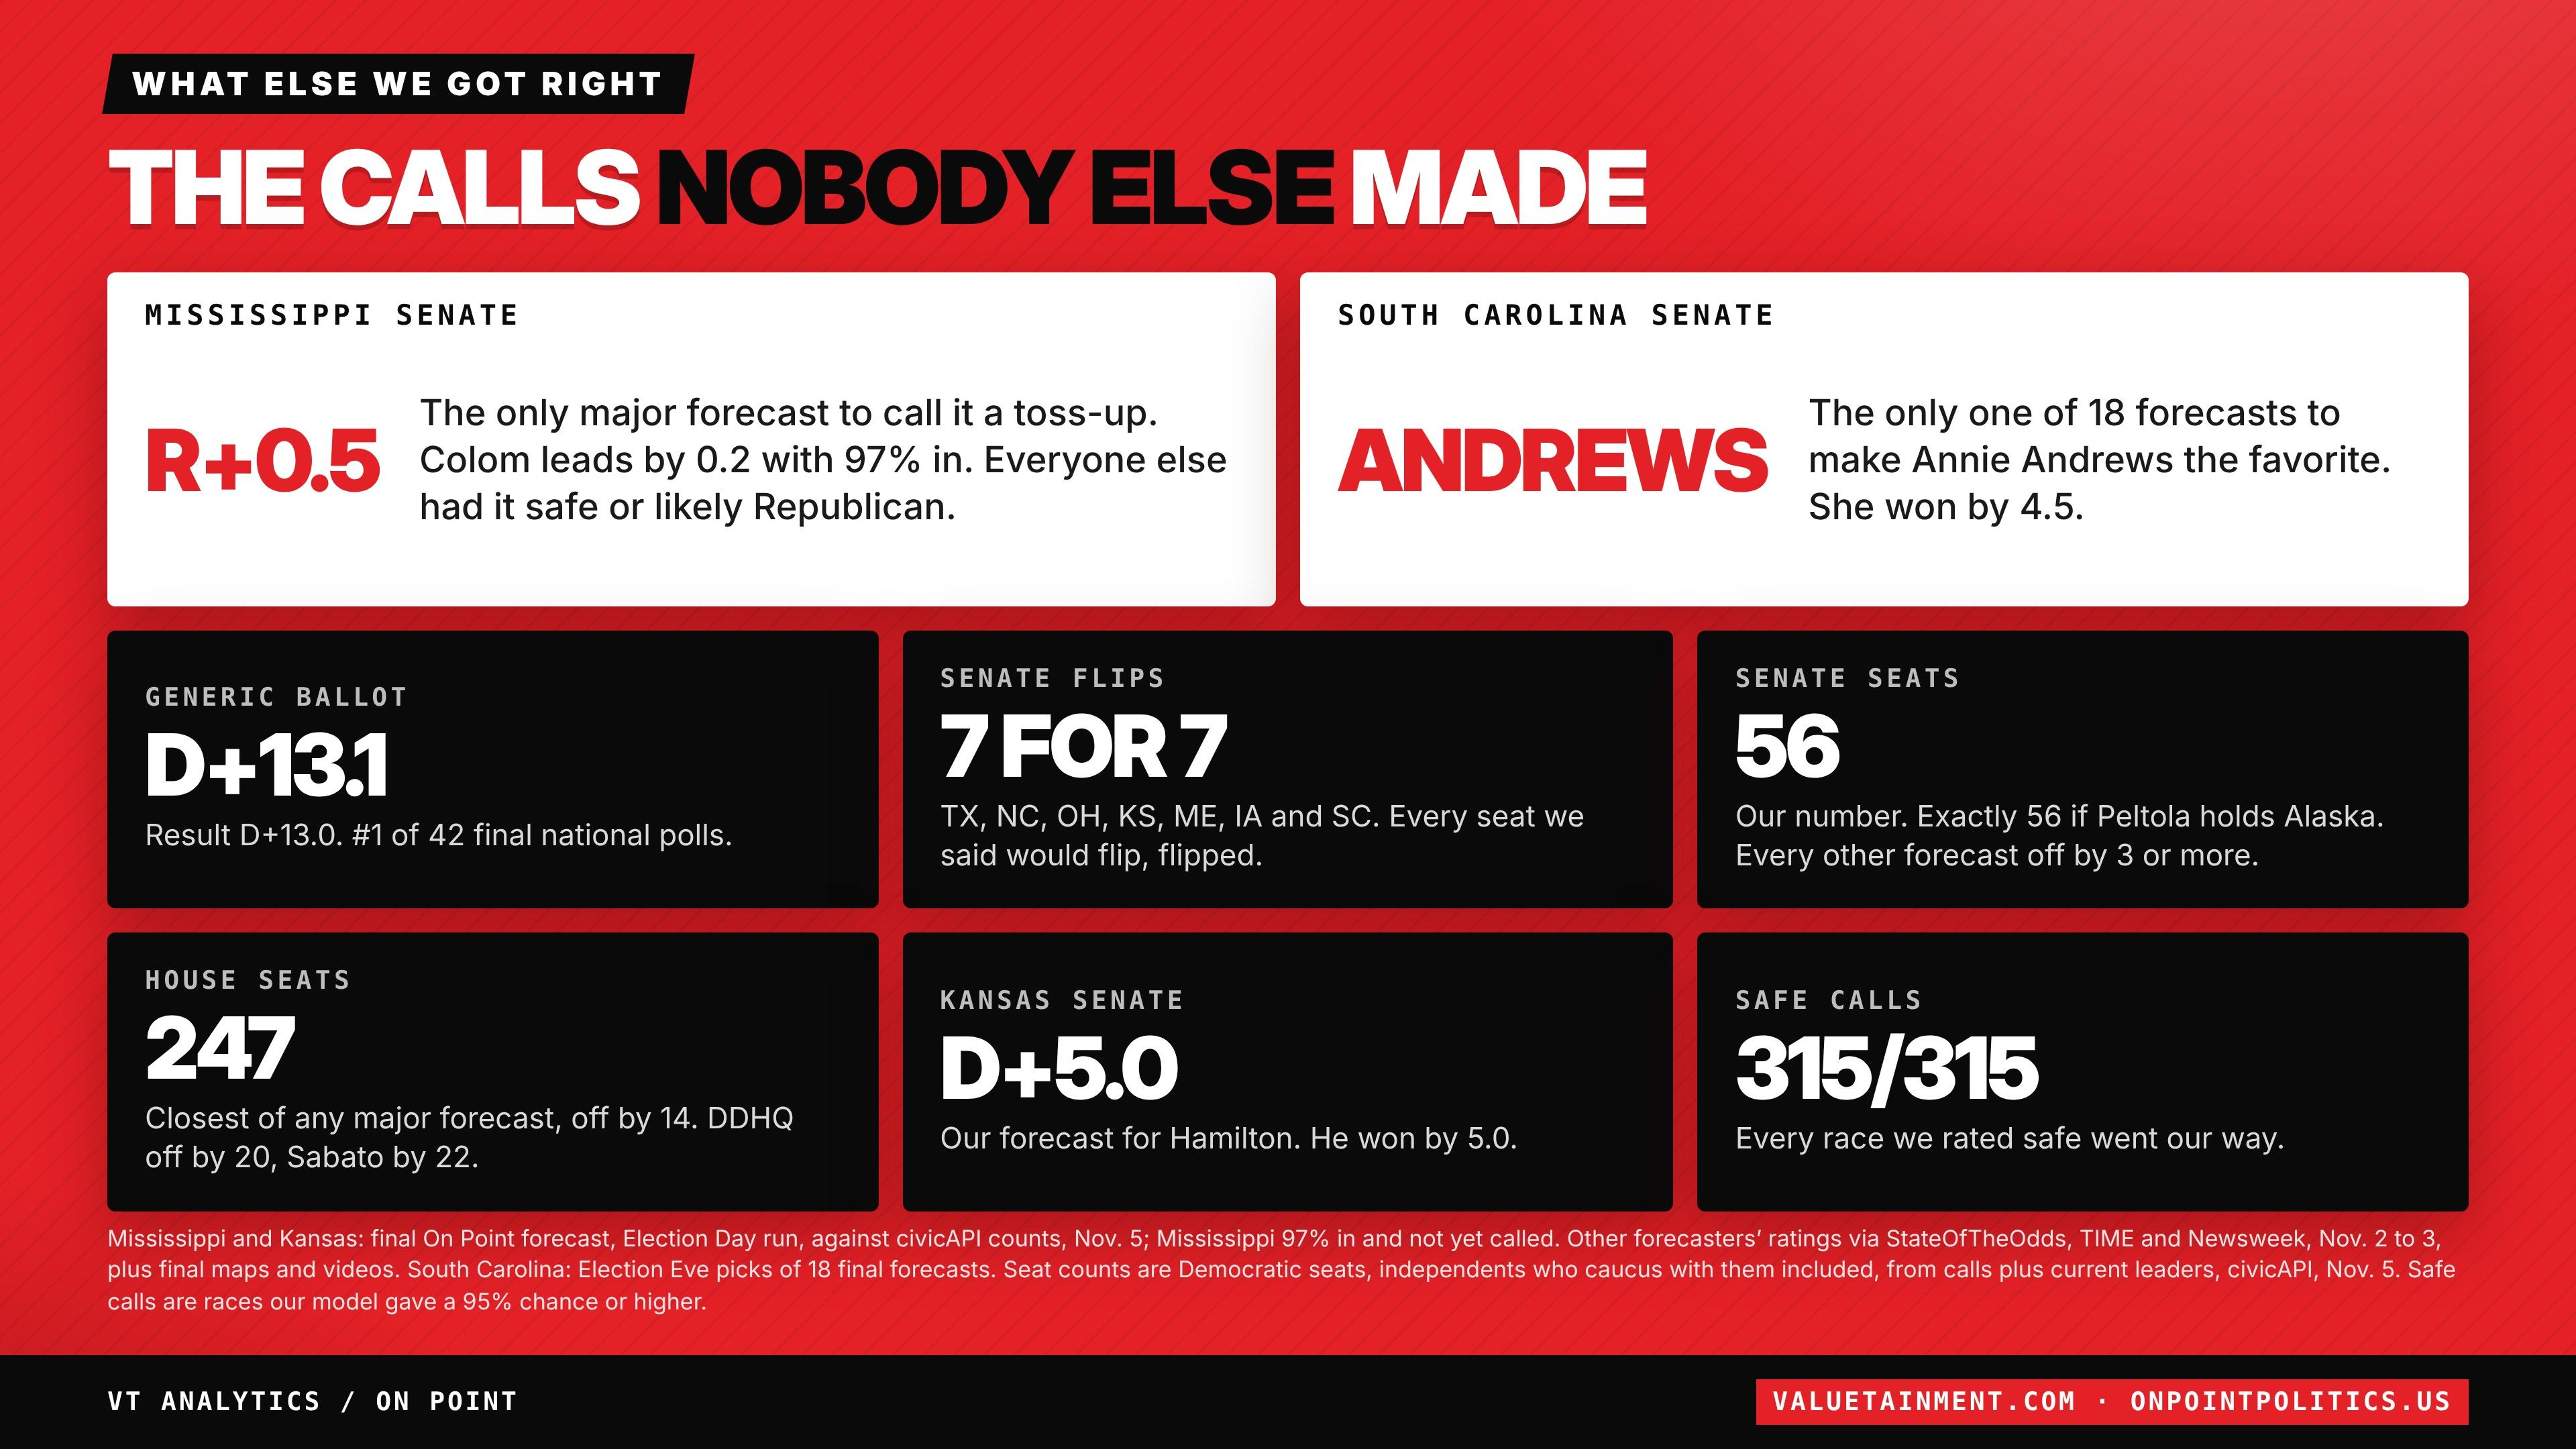
The calls nobody else made
Mississippi Senate
The only major forecast to call it a toss up. Colom leads by 0.2 with 97 percent counted; everyone else had it safe or likely Republican.
South Carolina Senate
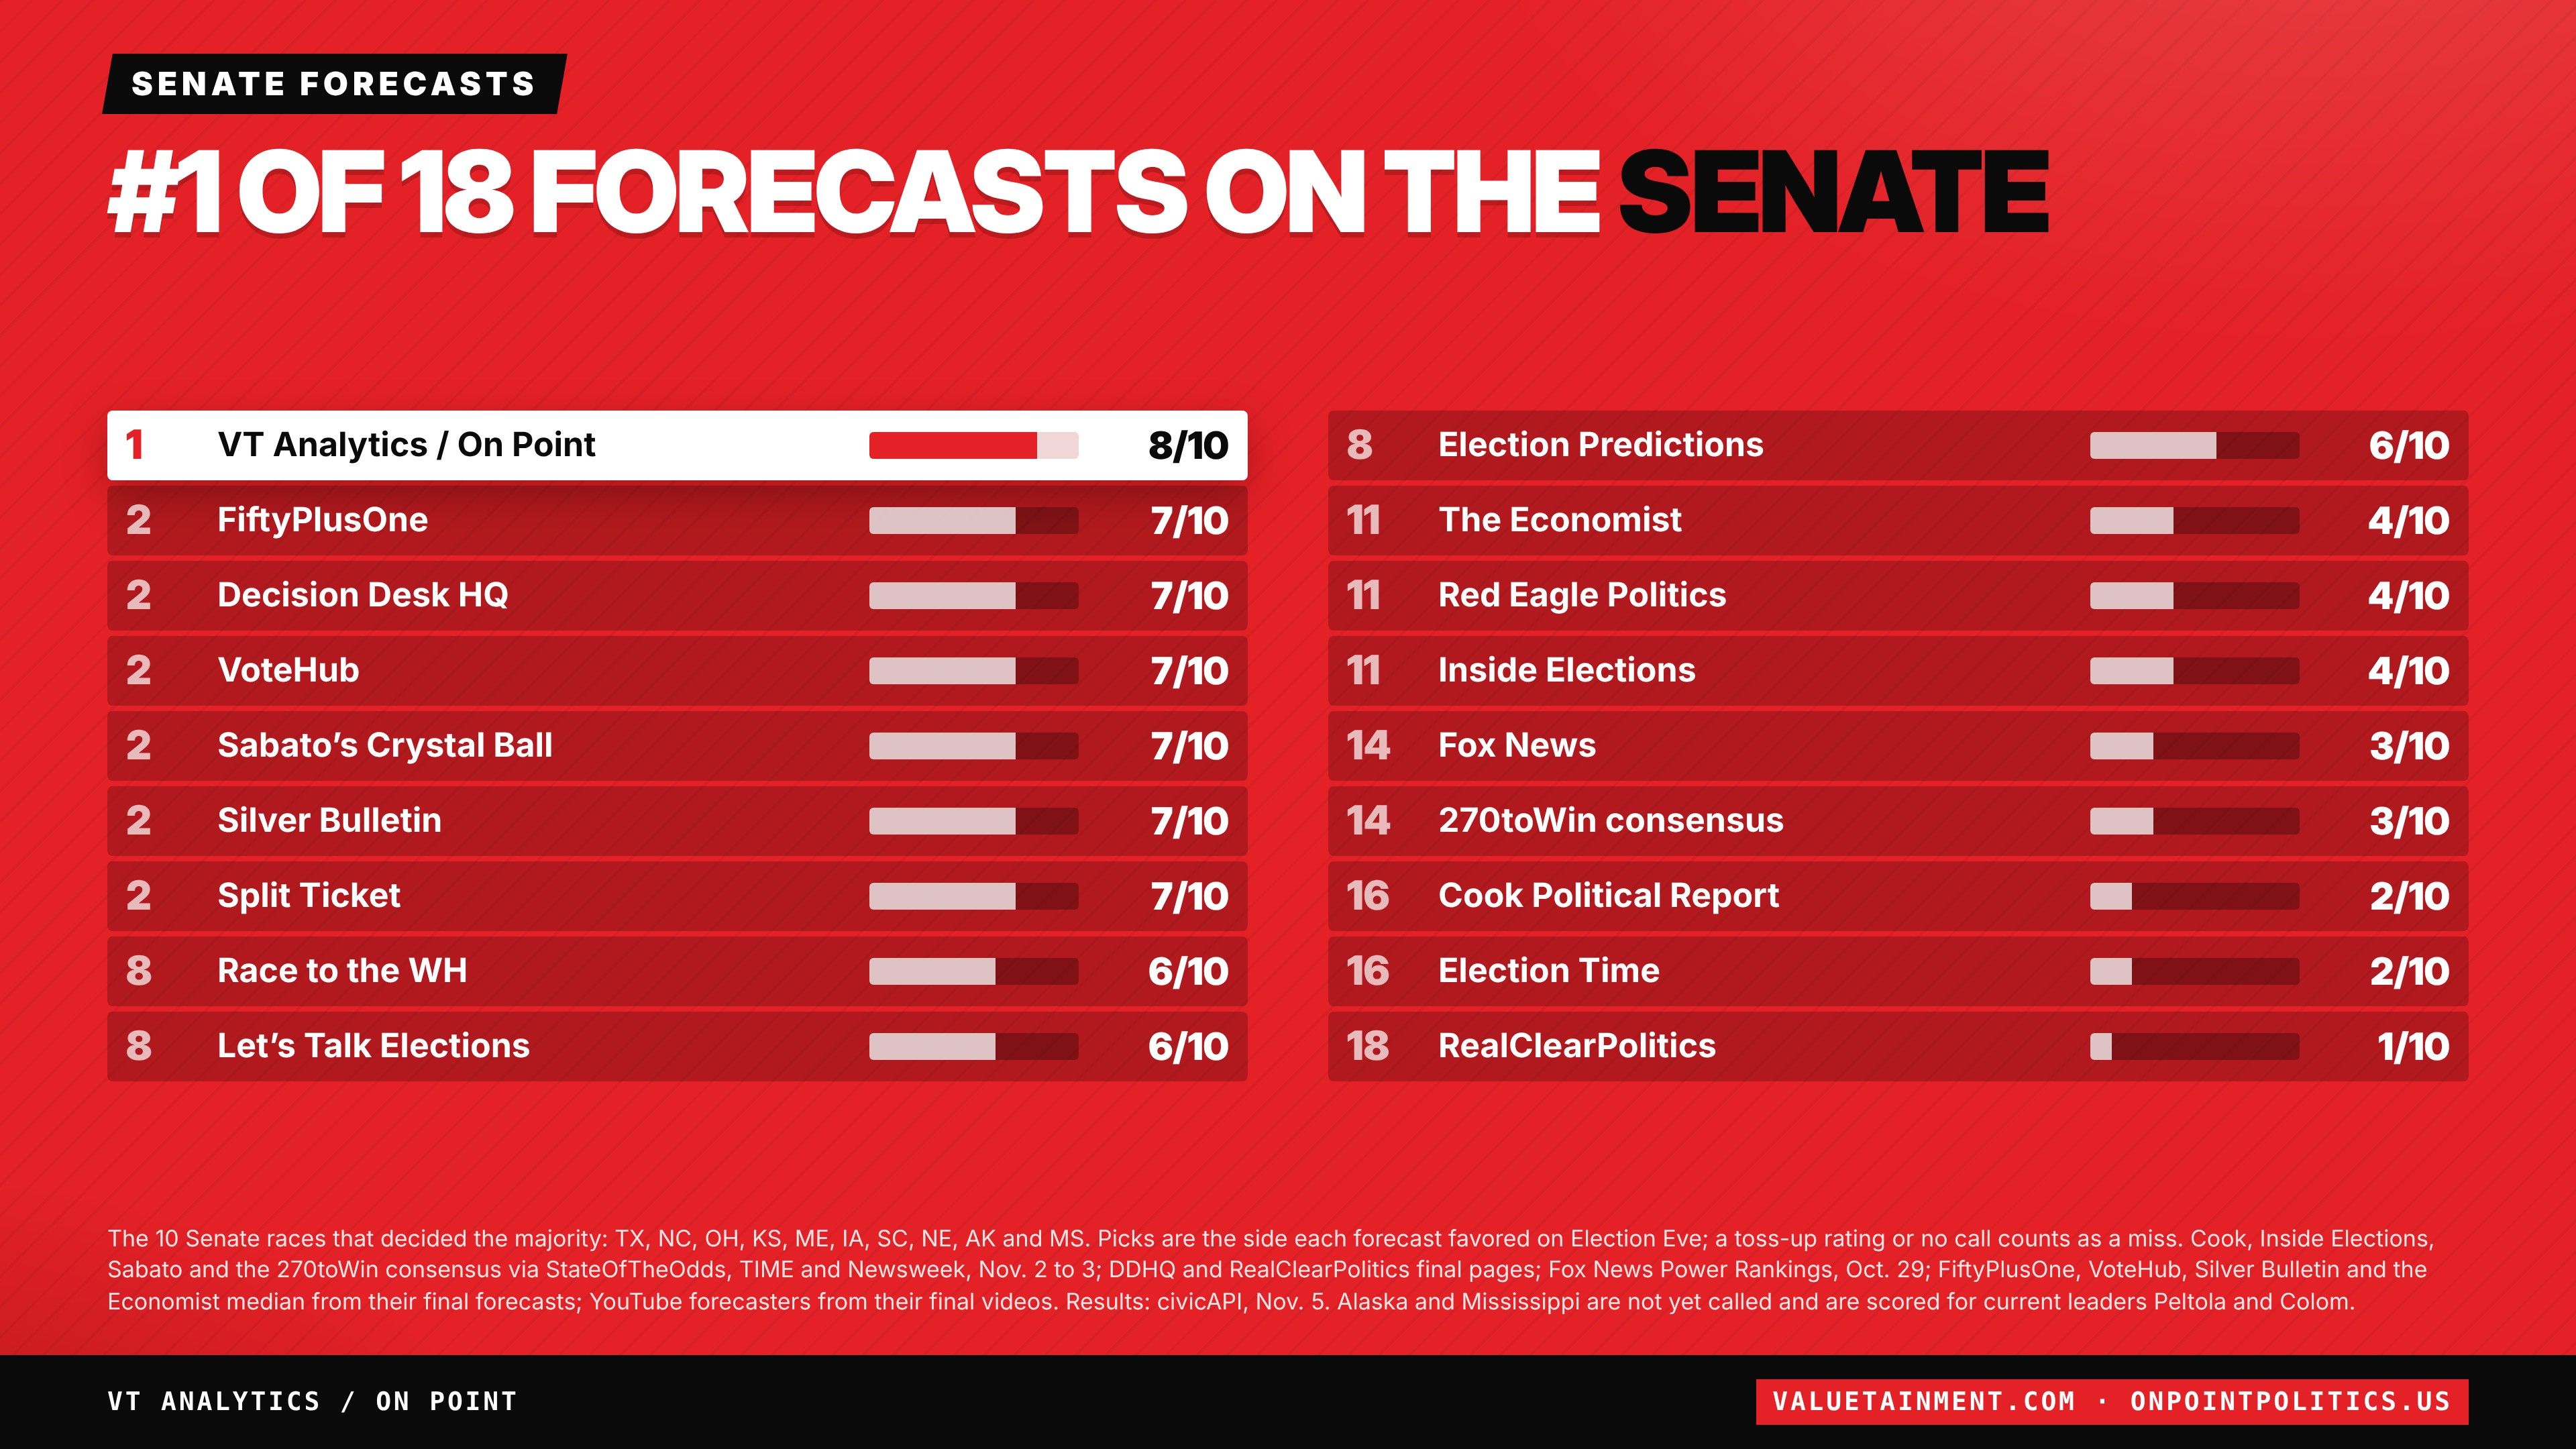
The only one of 18 forecasts to make Annie Andrews the favorite. She won by 4.5.
Generic ballot
The result is D +13.0. Number one of 42 final national polls.
Senate flips
Texas, North Carolina, Ohio, Kansas, Maine, Iowa and South Carolina. Every seat we said would flip, flipped.
Senate seats
Our number. Exactly 56 if Peltola holds Alaska; every other forecast was off by 3 or more.
House seats
The closest of any major forecast, off by 14. The next closest were off by 20 and 22.
Kansas Senate
Our forecast for Hamilton. He won by 5.0.
Safe calls
Every race our model gave a 95 percent chance or higher went our way.
Questions
Who was the most accurate pollster in 2026?
On Point Polling, the polling arm behind On Point Politics. Its final national survey had the generic ballot at D +13.1, against a projected final of D +13.0, and ranked first of 42 final national polls on margin and vote share.
Every number on this page is checkable. The forecast that used this polling is archived exactly as published on November 3, with a fingerprint for every file, and the accuracy report scores every race against the count.
Share it